ISM Structures Traced by
AKARI FIR All-Sky Dust Map
Yasuo Doi\(^1\), T. Ootsubo\(^2\), S. Takita\(^2\), T. Nakagawa\(^2\), M. Kawada\(^2\), Y. Kitamura\(^2\),
S. Matsuura\(^3\), M. Hattori\(^4\), M. Tanaka\(^5\) \(^1\)U. of Tokyo, \(^2\)ISAS, \(^3\)Kwansei U., \(^4\)Tohoku U., \(^5\)Tsukuba U.
Outline
- Dust column estimation by AKARI FIR all sky survey
- Quality improvement of FIR images ( ongoing )
- Total dust emission: \(T_{col},~ \tau\), and radiance \(\mathcal{R}\)
- Possible dust growth traced by AKARI FIR data
- ISM structures extraction from AKARI FIR images
- Alignment of ISM structures with magnetic fields
- ISM structures and YSOs spatial distributions
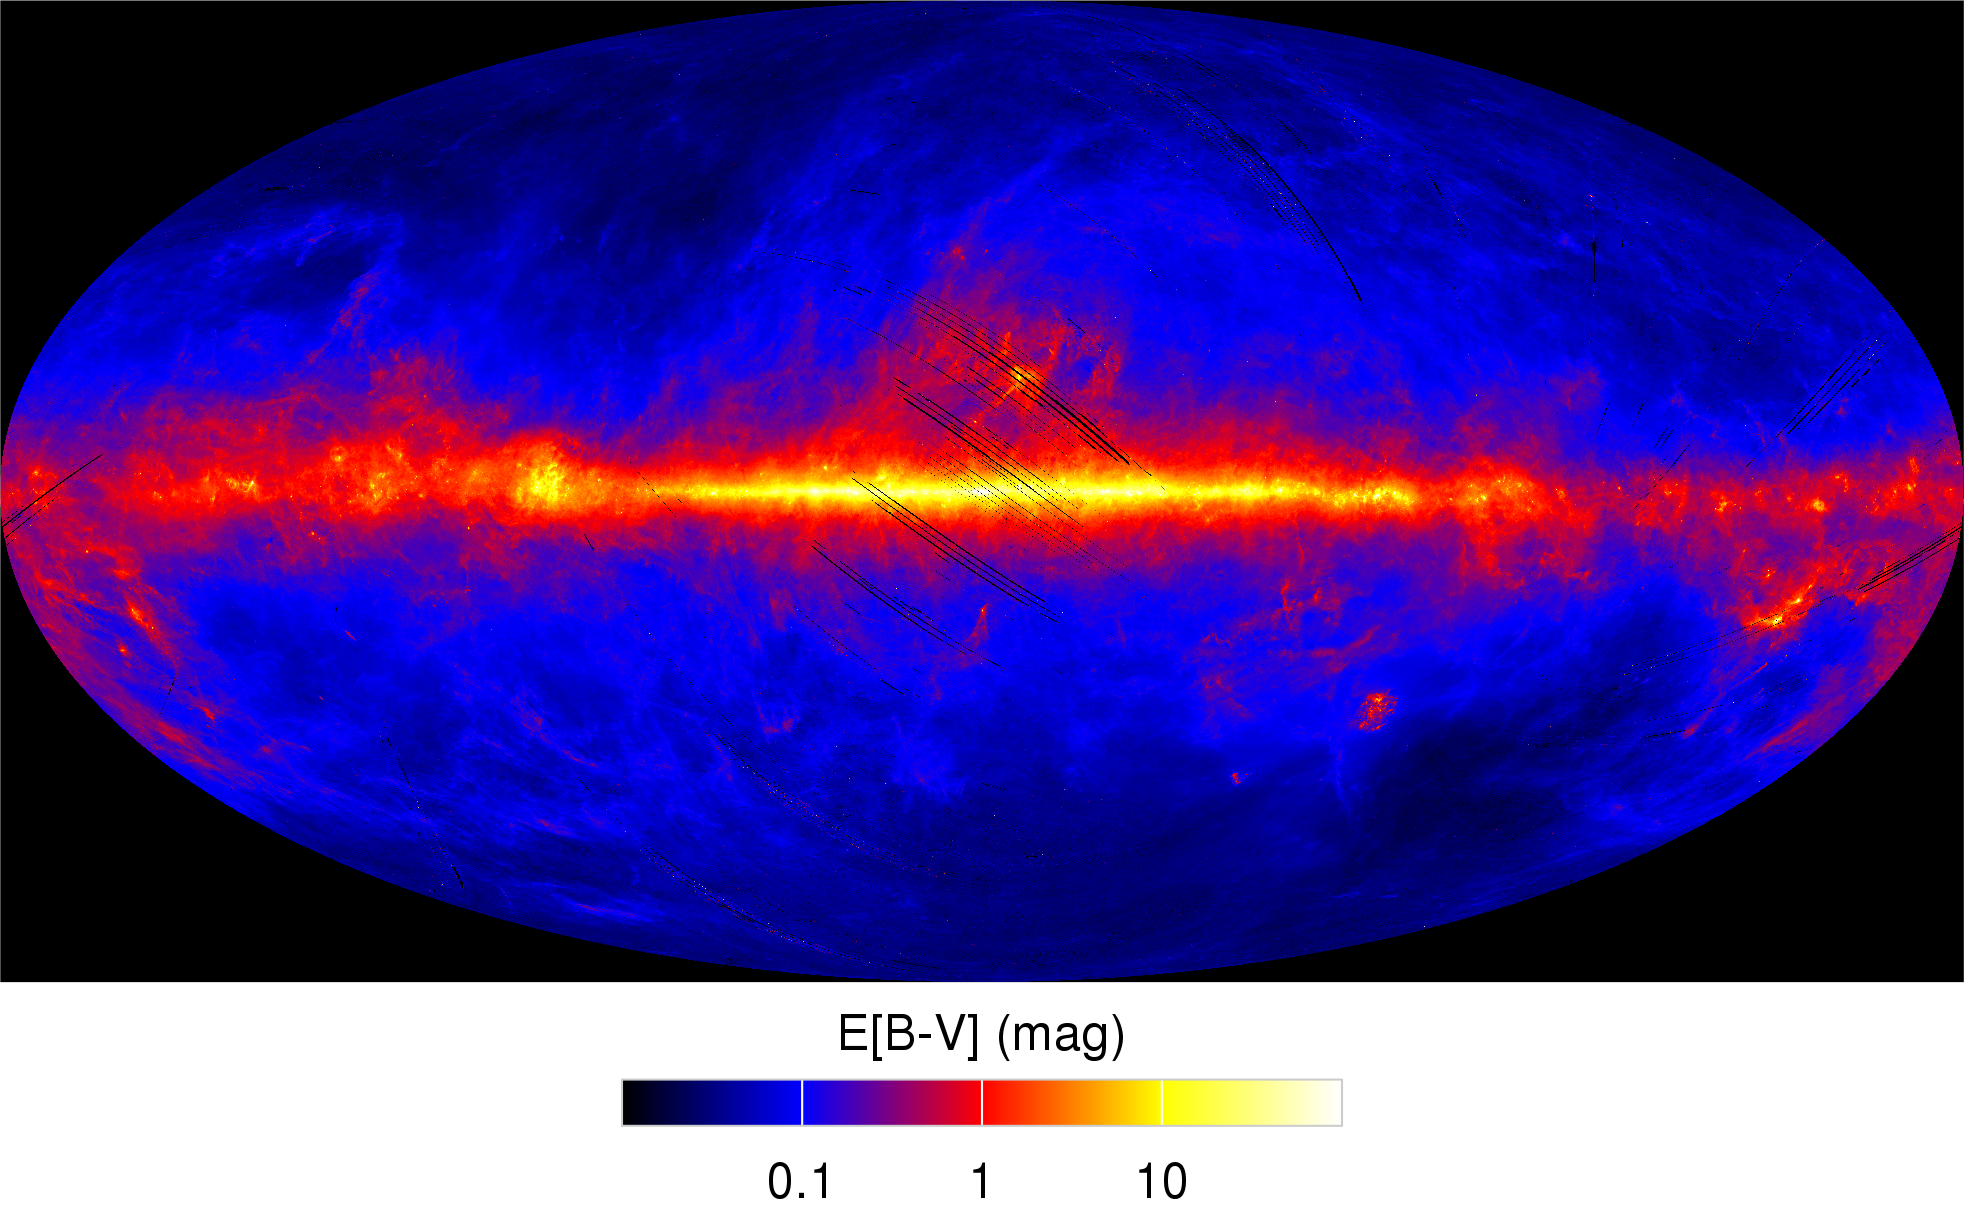
FIR dust map from AKARI data
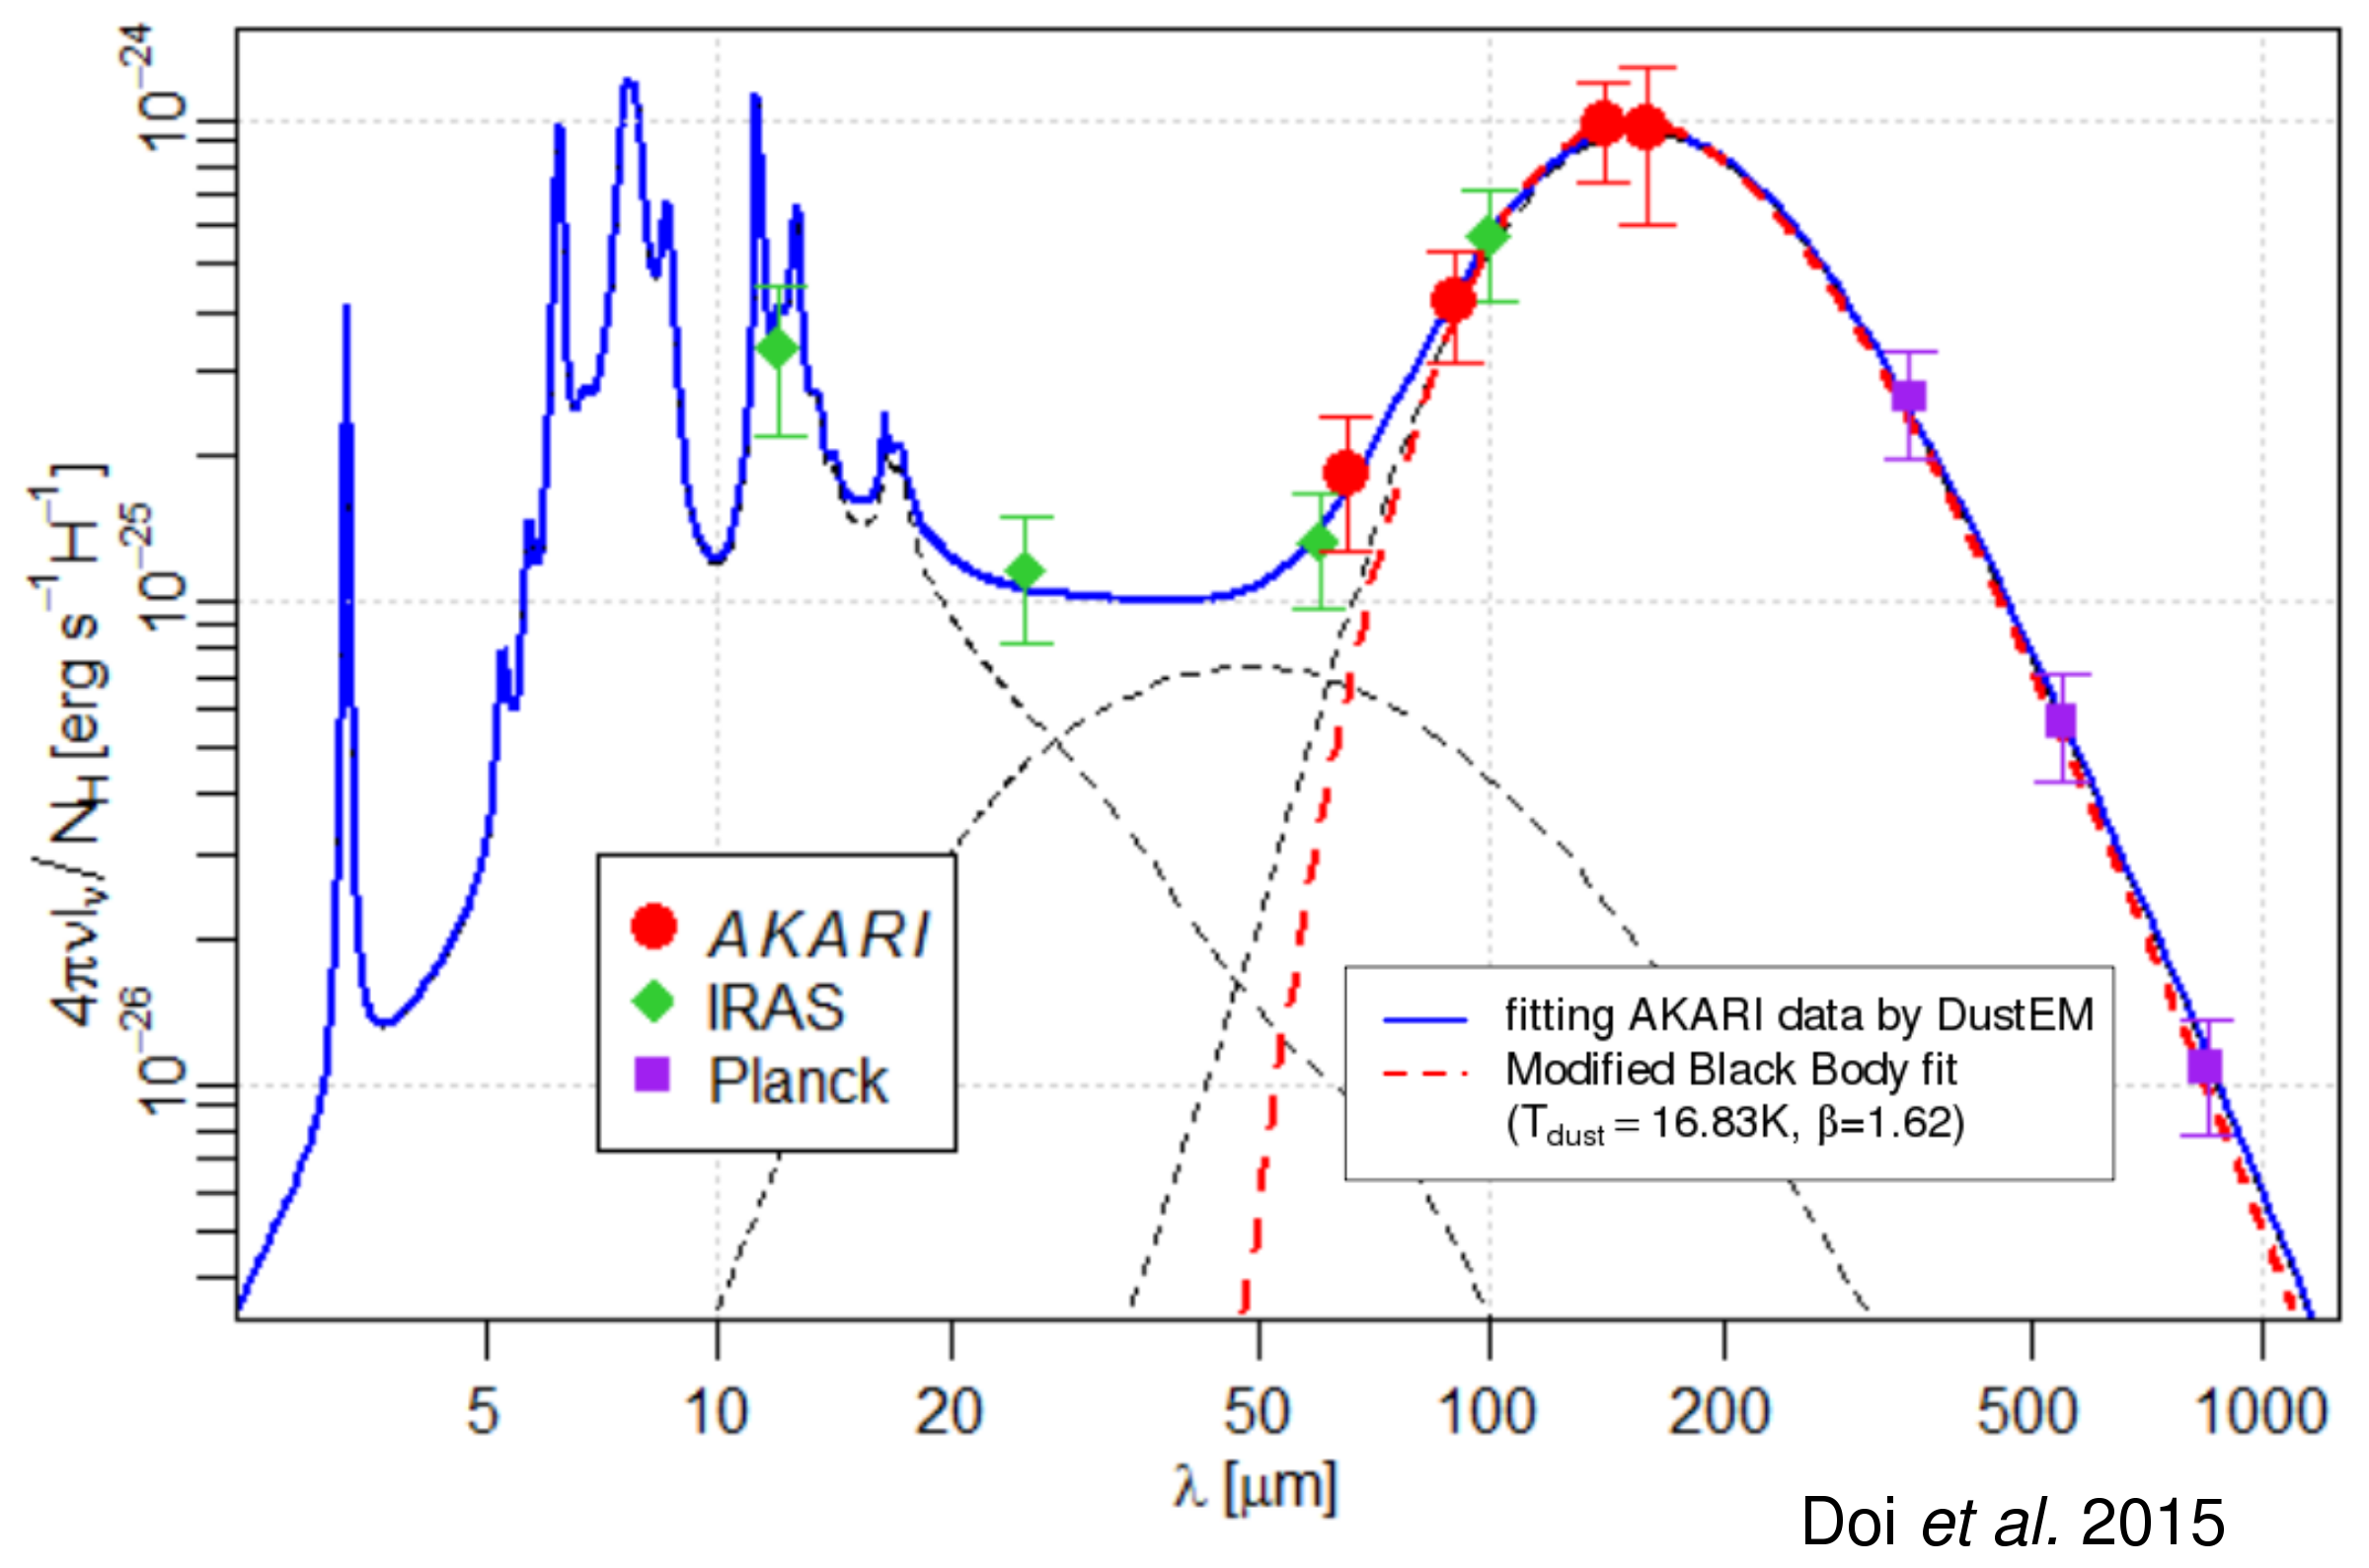
- 90\(\mu\)m, 140\(\mu\)m \(\to\) \(T_{col}\), \(\tau\), radiance
- \(\beta\): fixed or refer Planck data, etc.
- Model SED fit by DustEM, etc.
Other FIR dust maps
- SFD : IRAS \(5'+\)T\(_{DIRBE}\)\(60'\)
- IRAS + Planck : \(5'\)
- cf. AKARI: \(1'\)~\(2'\)

Spatial resolution
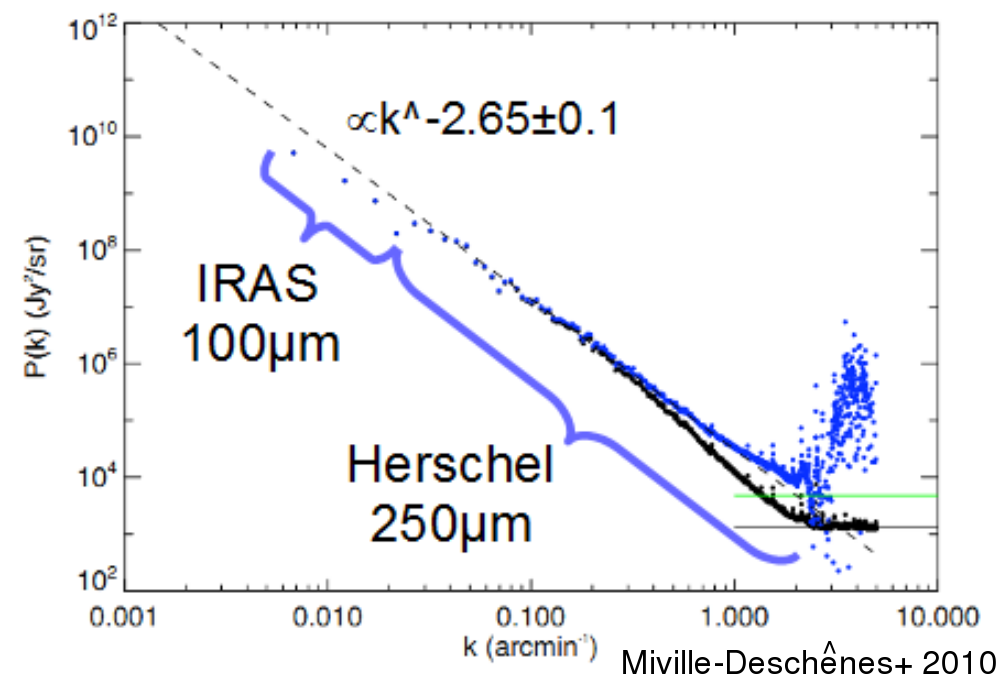
- IR cirrus spatial power spectra
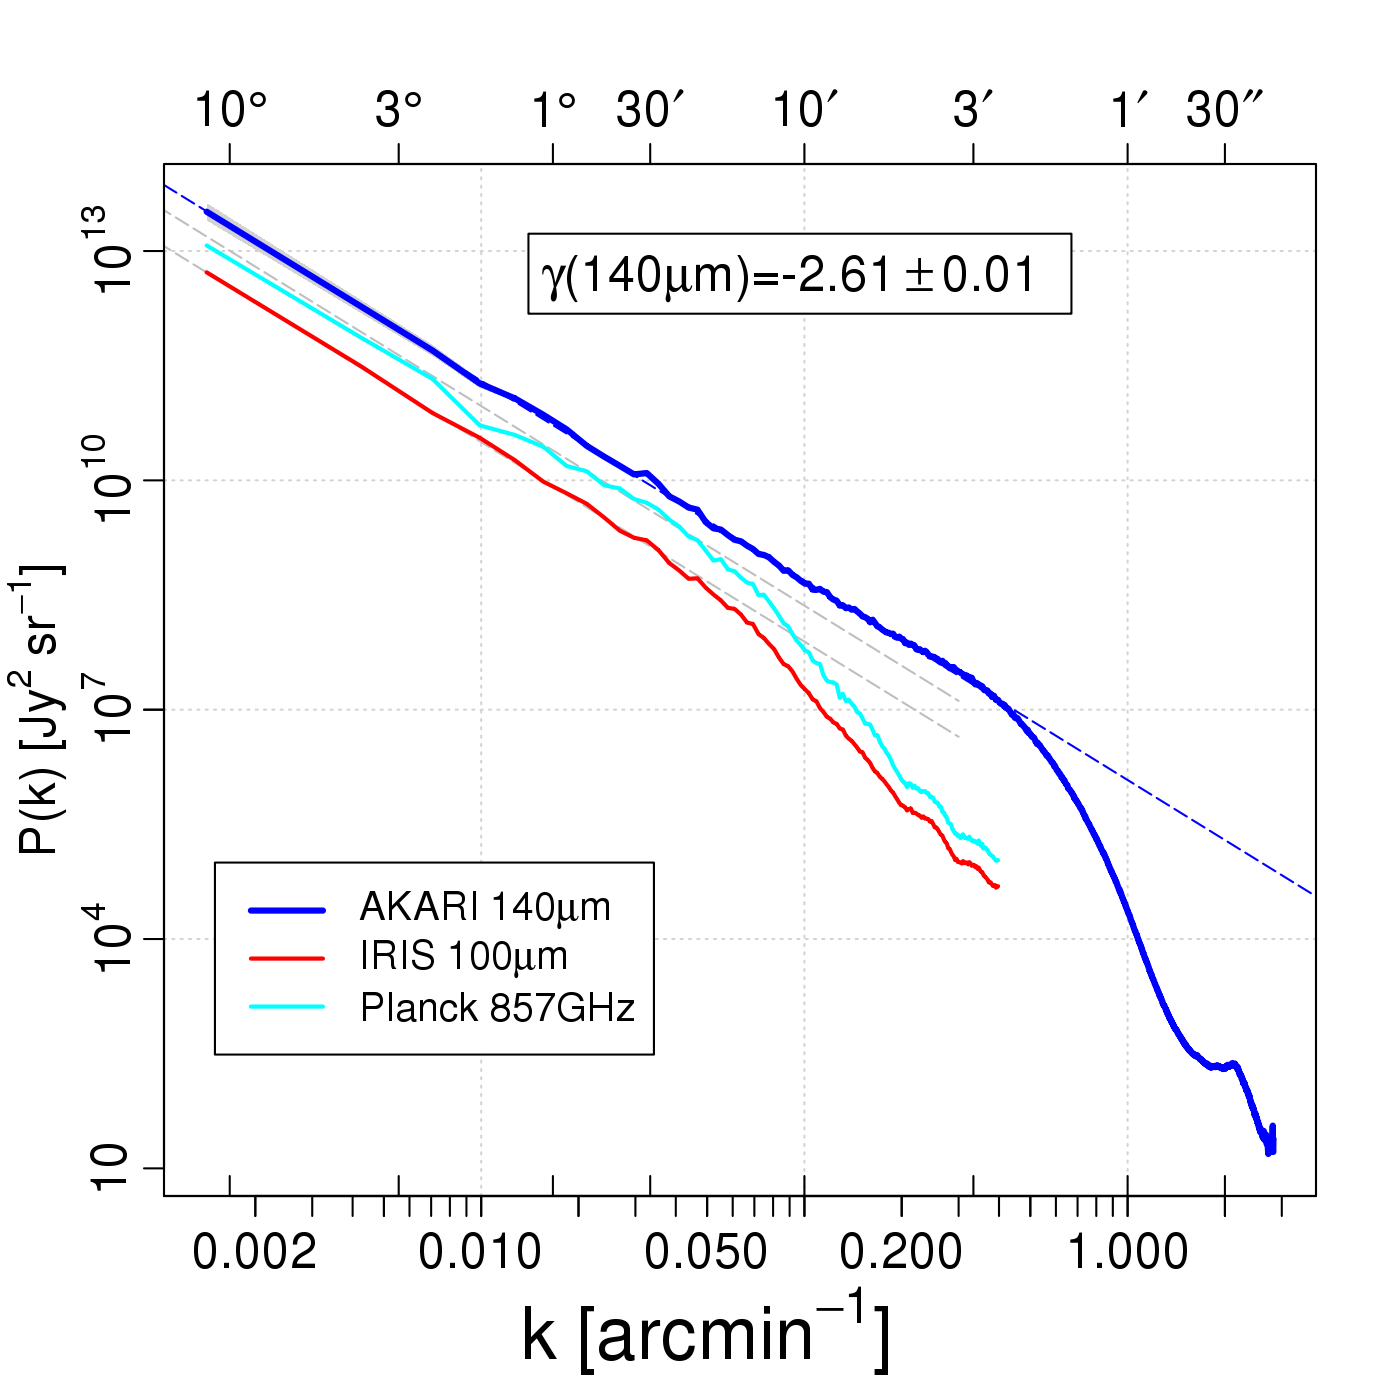
- AKARI traces spatial structures donw to \(1'\)~\(2'\)
- Effective spatial resolution of IRIS & Planck \(\sim30'\)(!?)
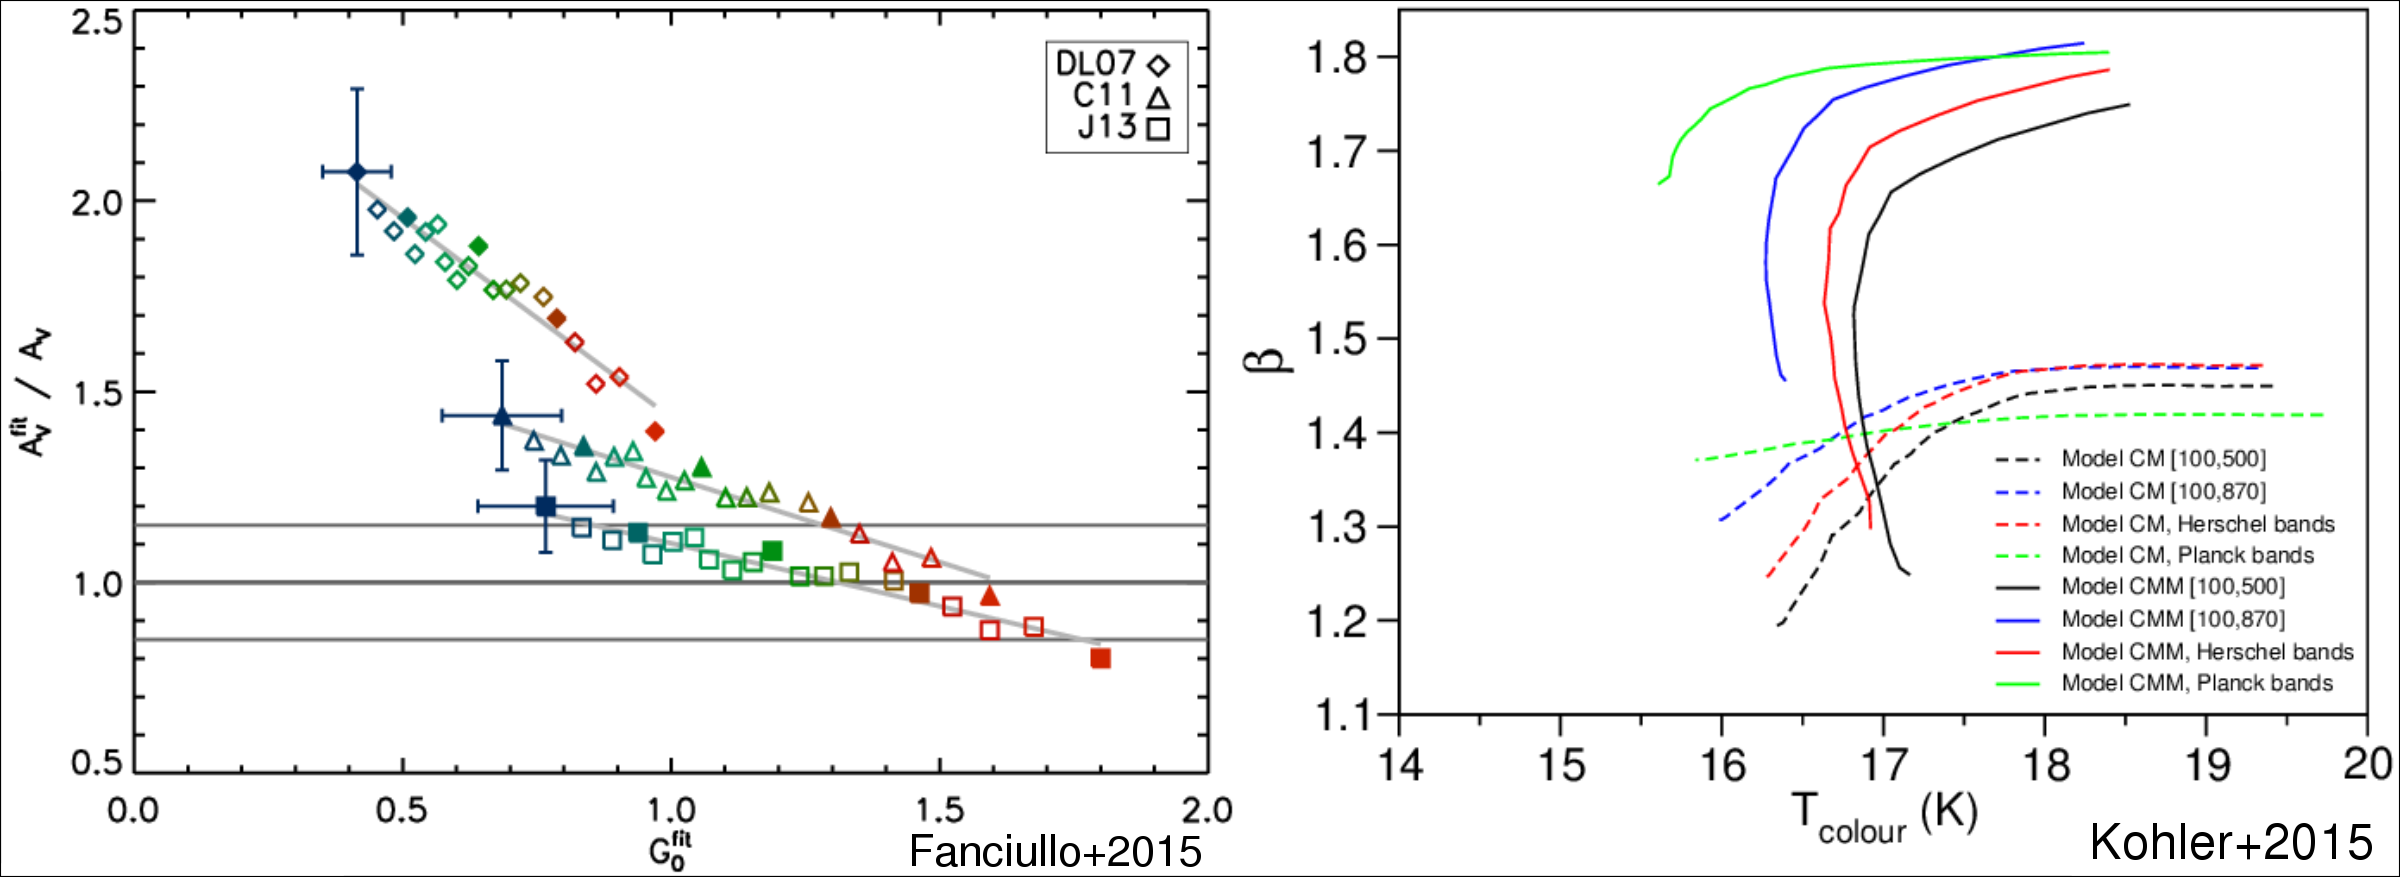
HI+CO "dark gas"
Variation of dust characteristics between diffuse ISM, dense quiescent cloud, active SFR, etc.
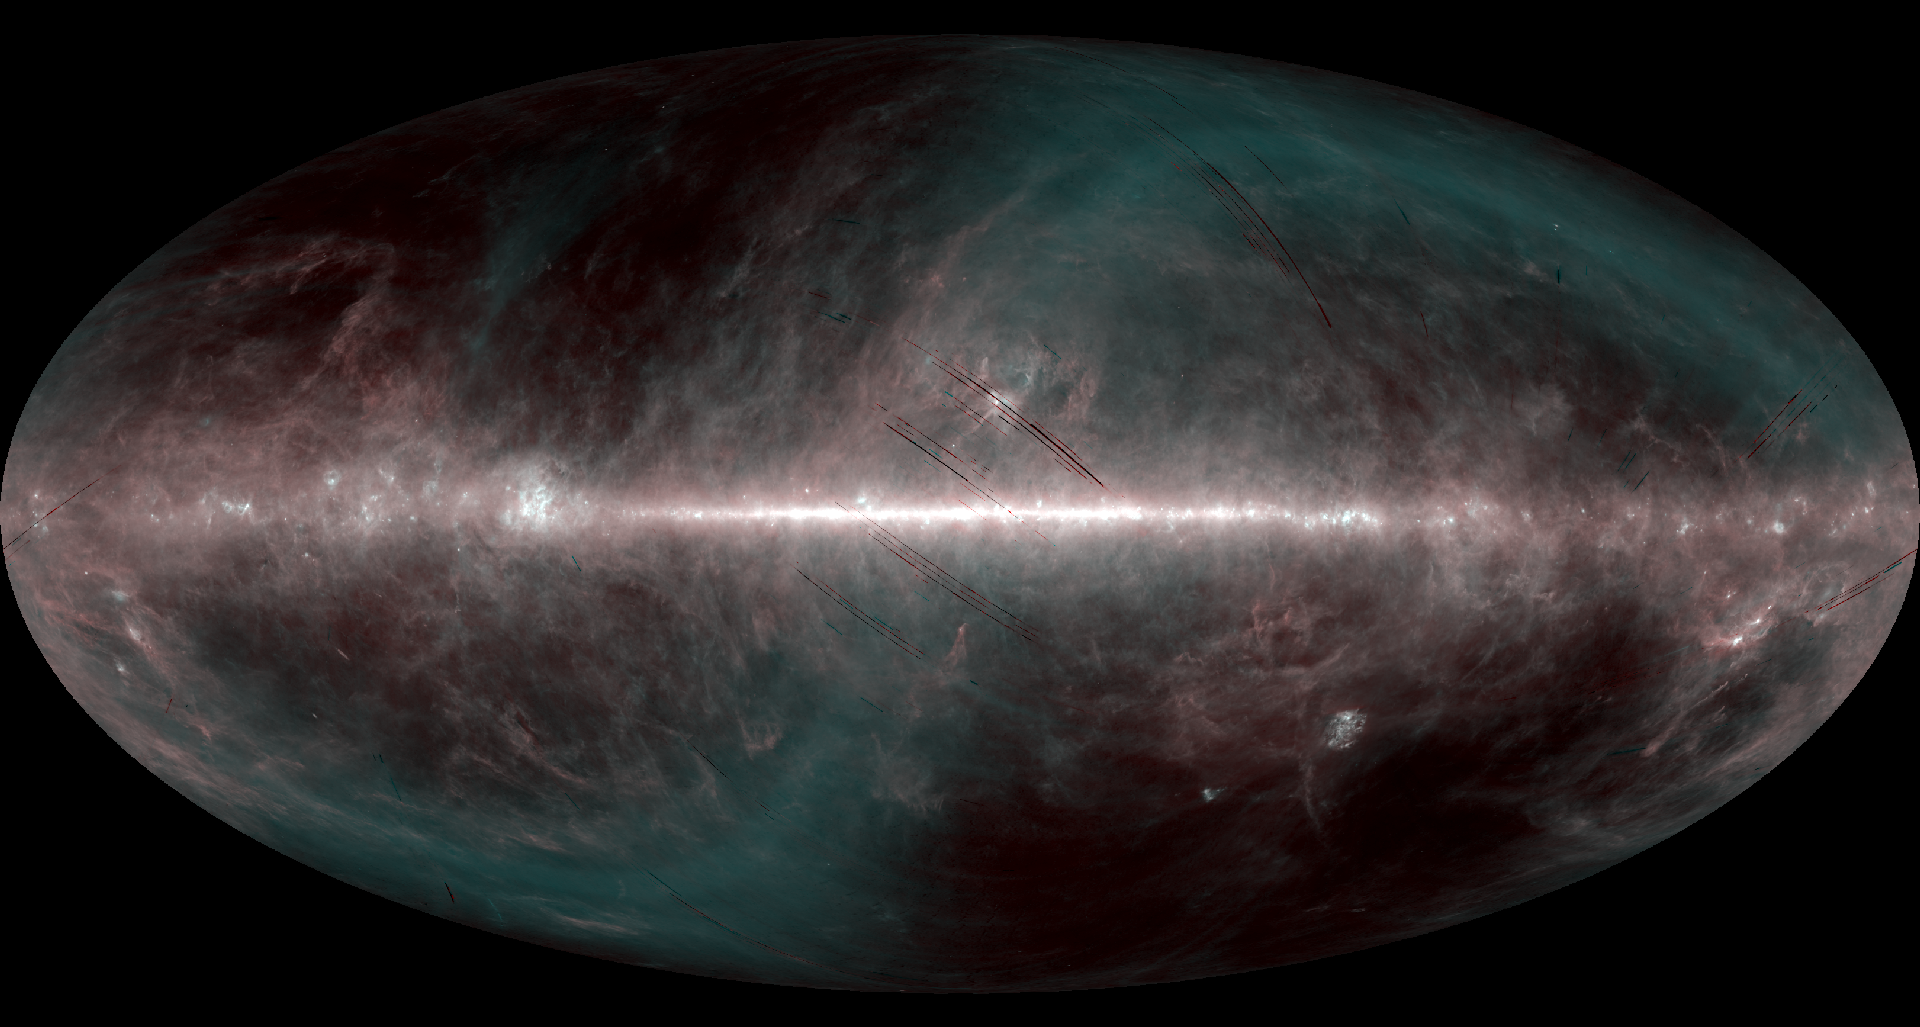
Better subtraction of Zodi emission
- Released all-sky image contains residual Zodi emission
- Zodi dust band model by Ootsubo et al. (2016)
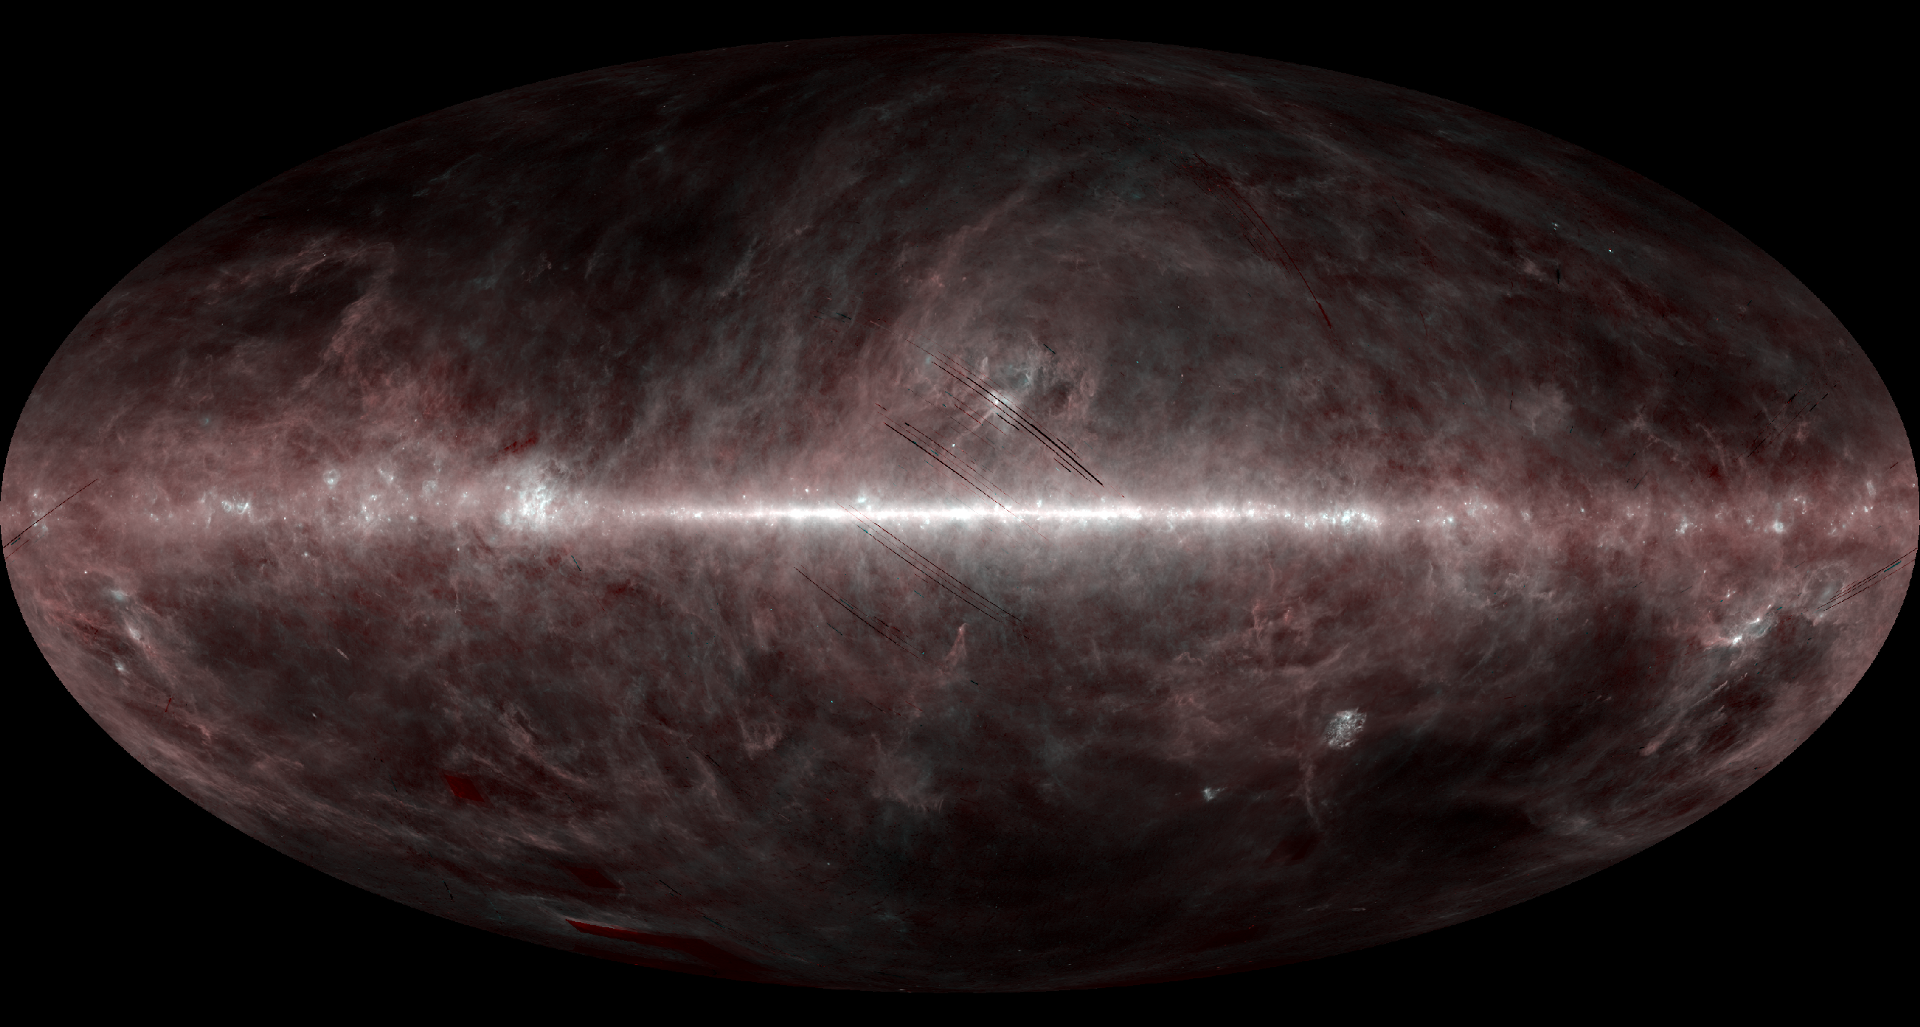
Better subtraction of Zodi emission
- Zodi subtraction by Ootsubo et al. (2016)
- All-sky dust map from astronomical intensity image
An update of AKARI FIR all-sky intensity images
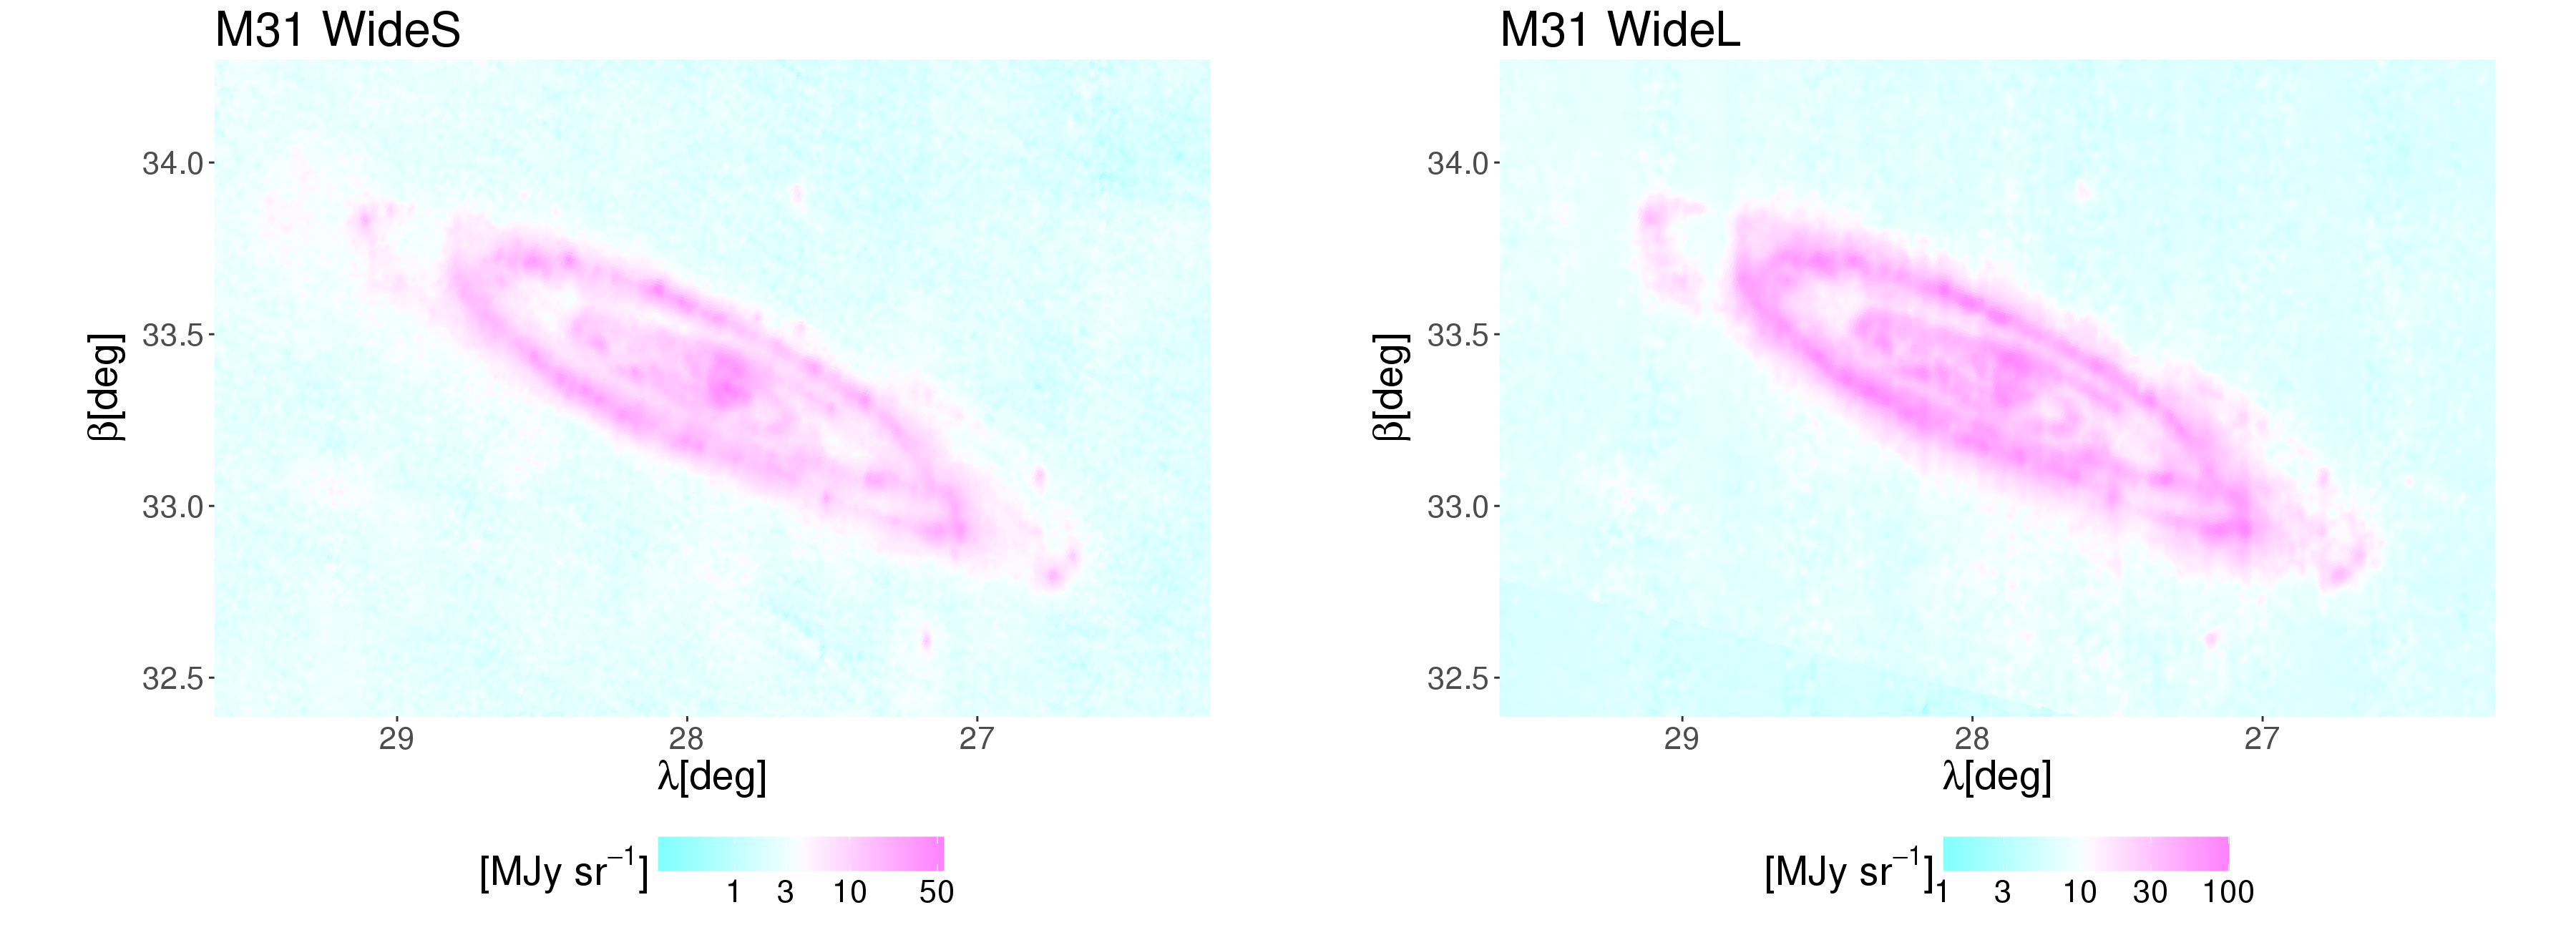
- improved spatial resolution: \(1' - 2'\) \(\to\) \(30'' - 1'\)
- improved sensitivity / elimination of low level artefact patterns
An update of AKARI FIR all-sky intensity images
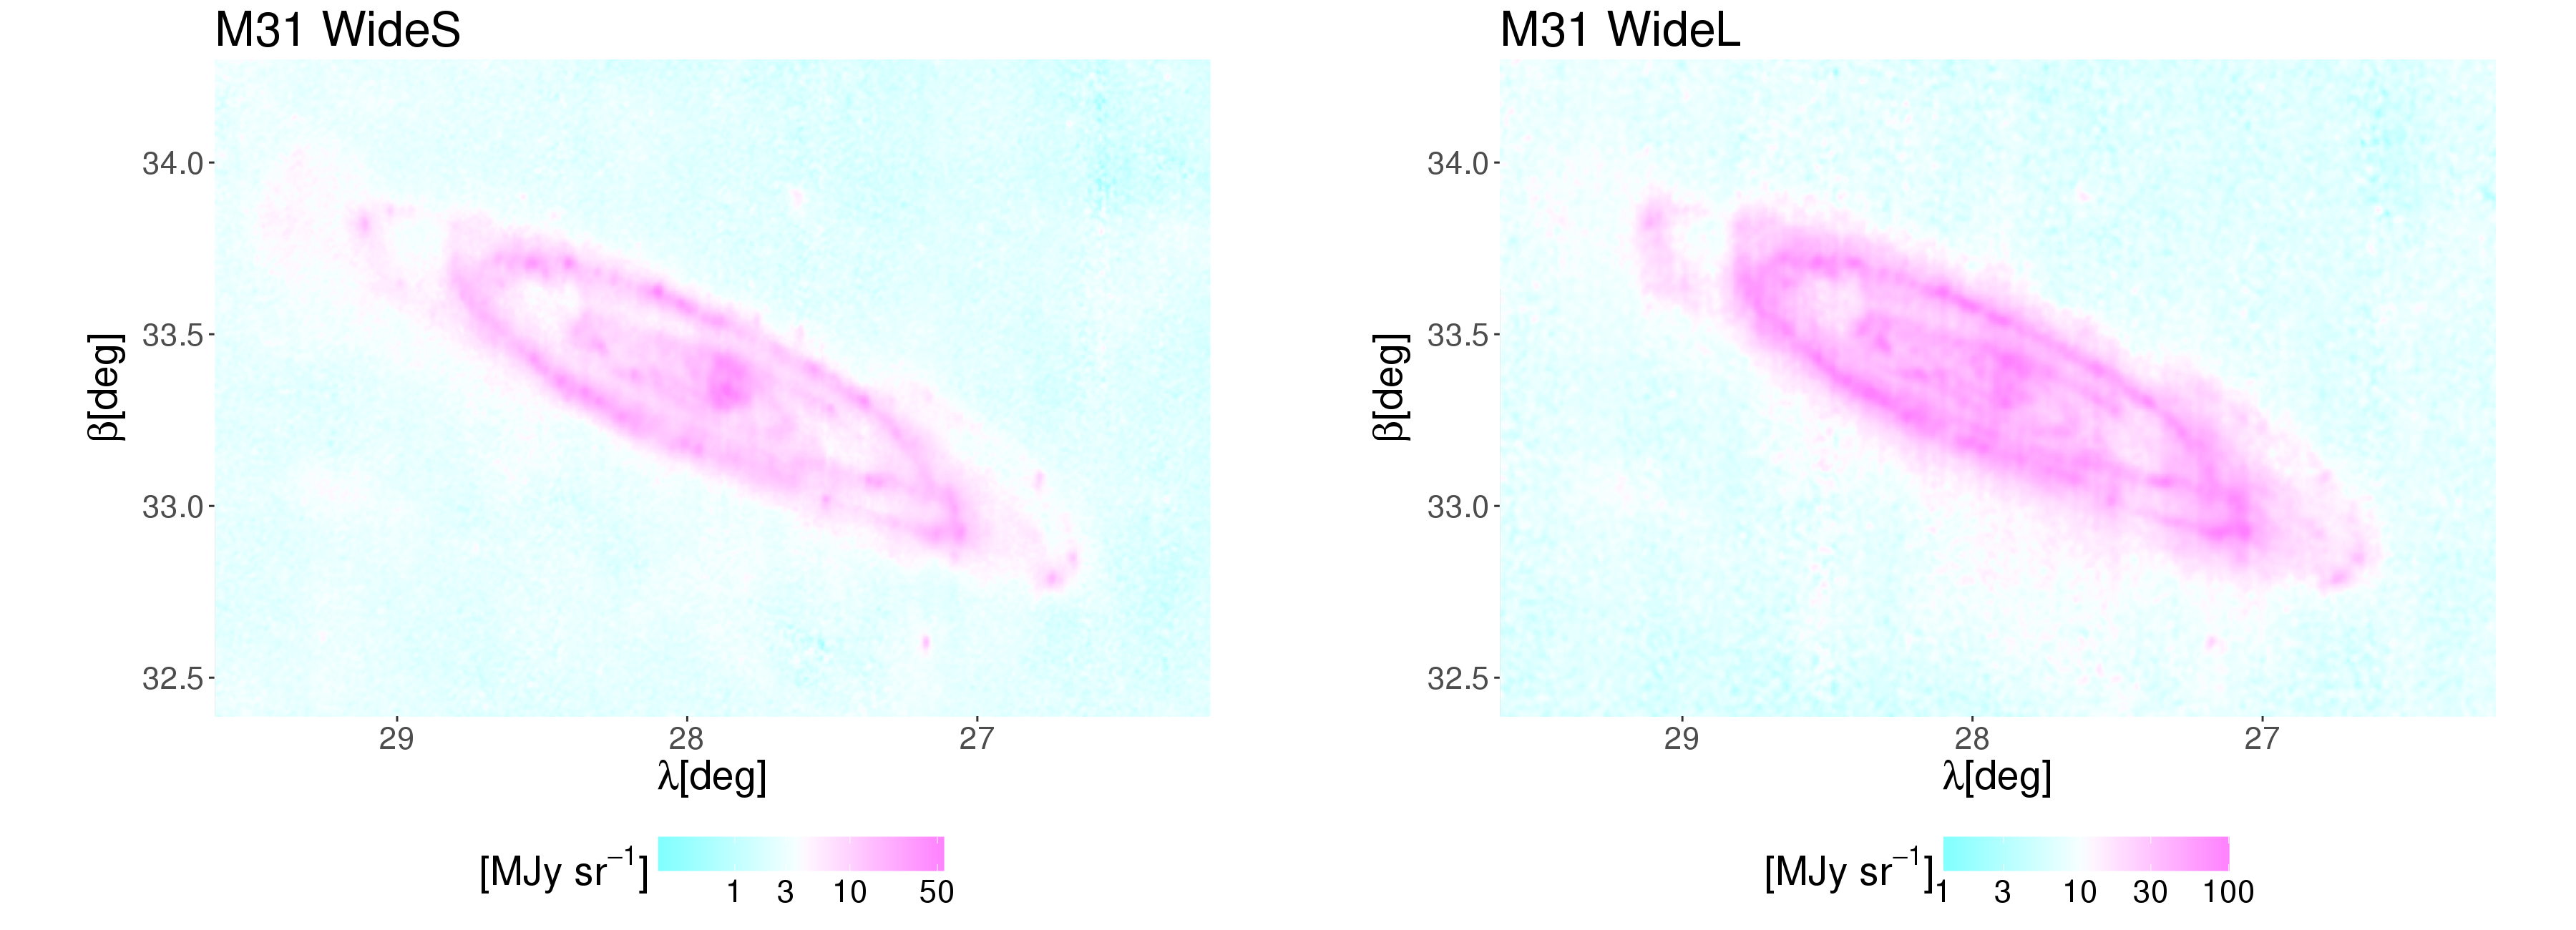
- improved spatial resolution: \(1' - 2'\) \(\to\) \(30'' - 1'\)
- improved sensitivity / elimination of low level artefact patterns
M31 AKARI & Herschel images
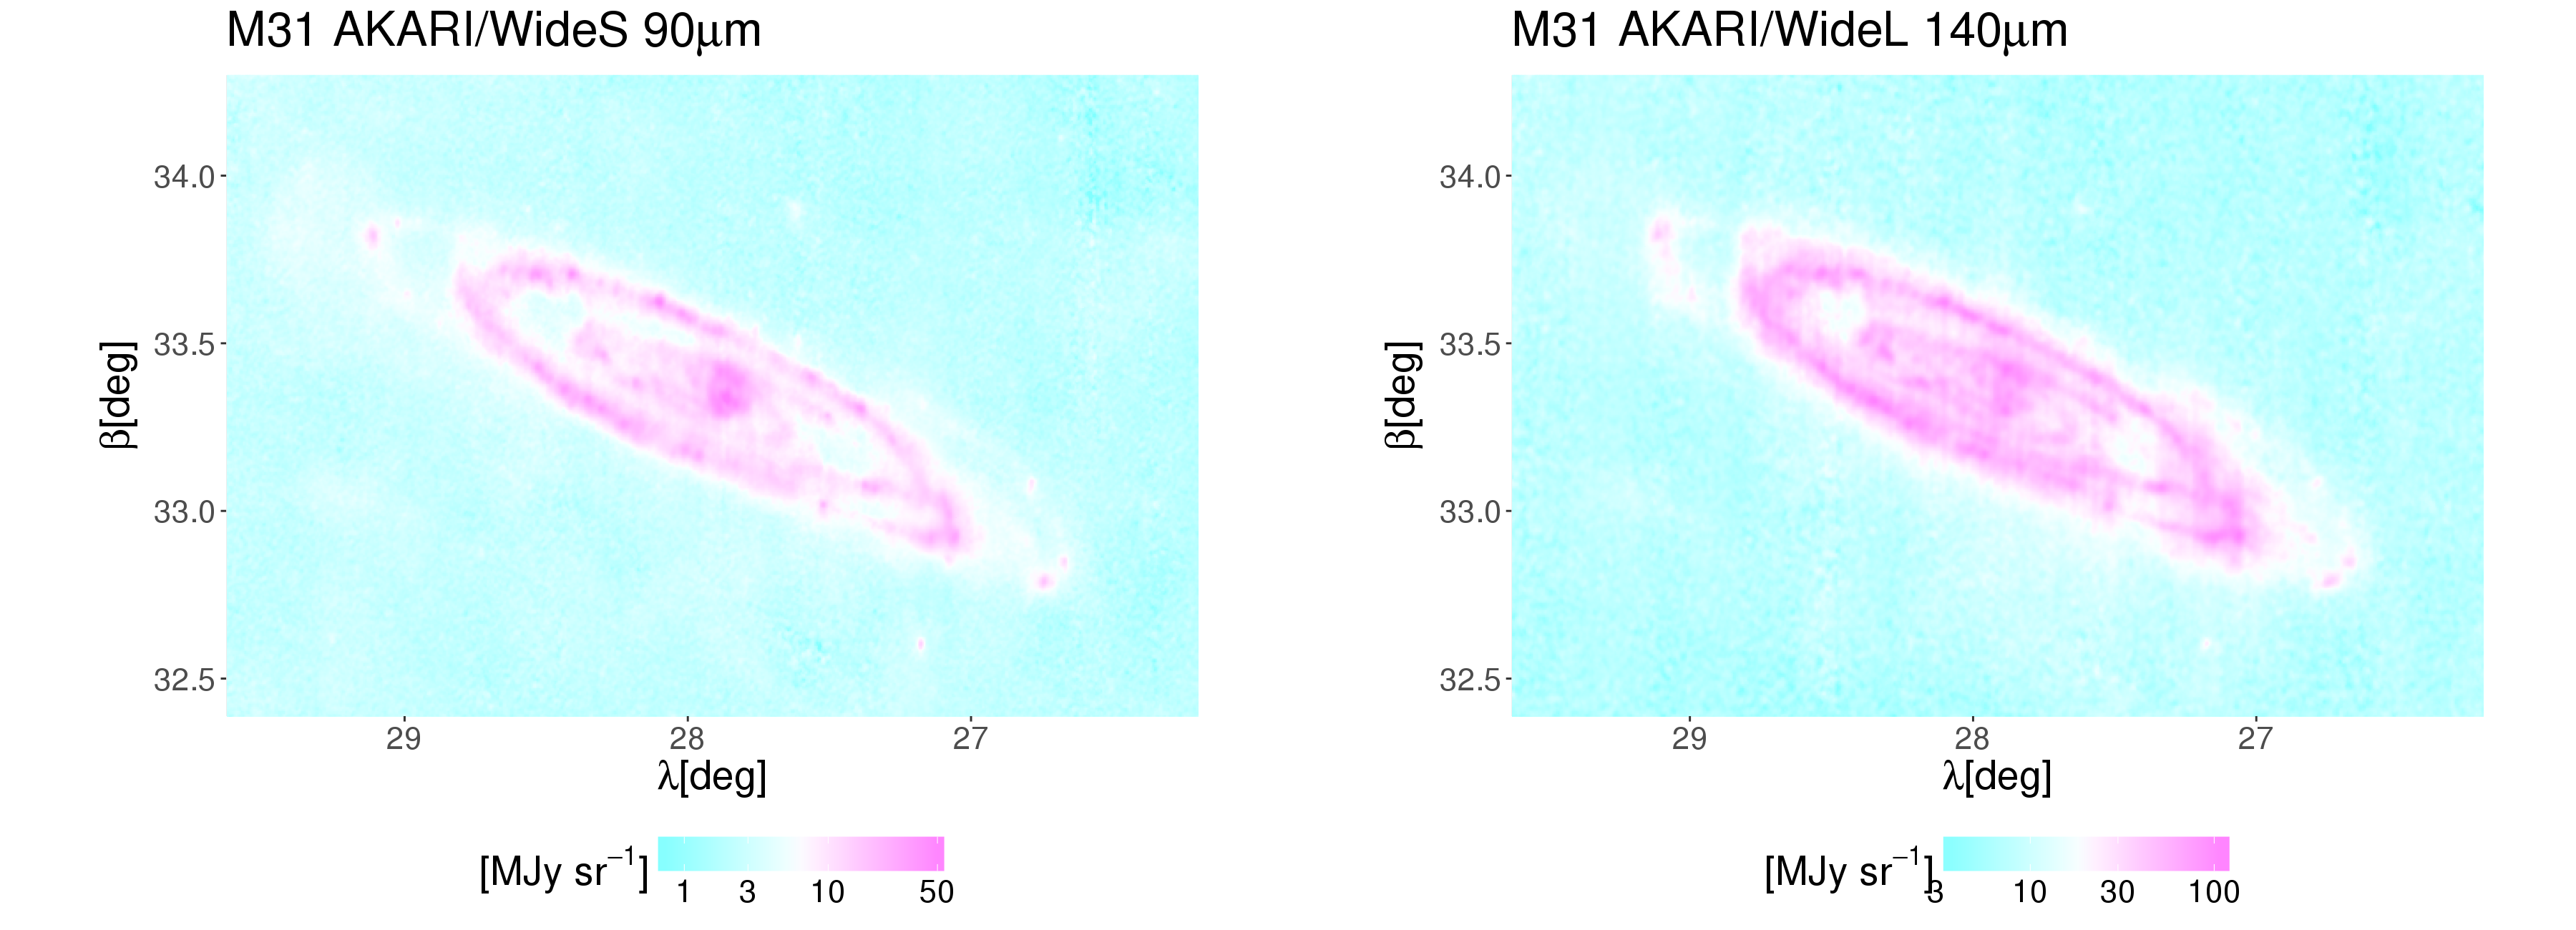
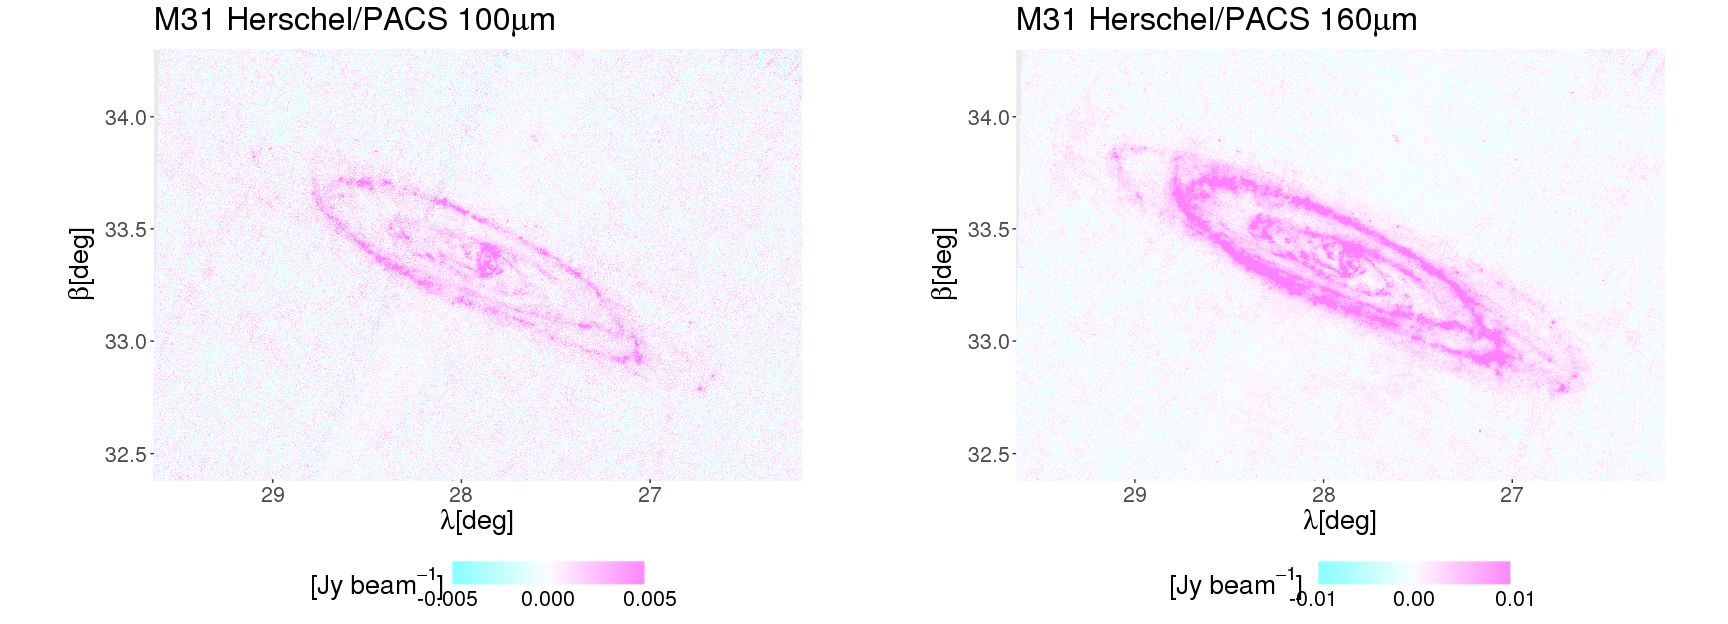
An update of AKARI FIR all-sky intensity images
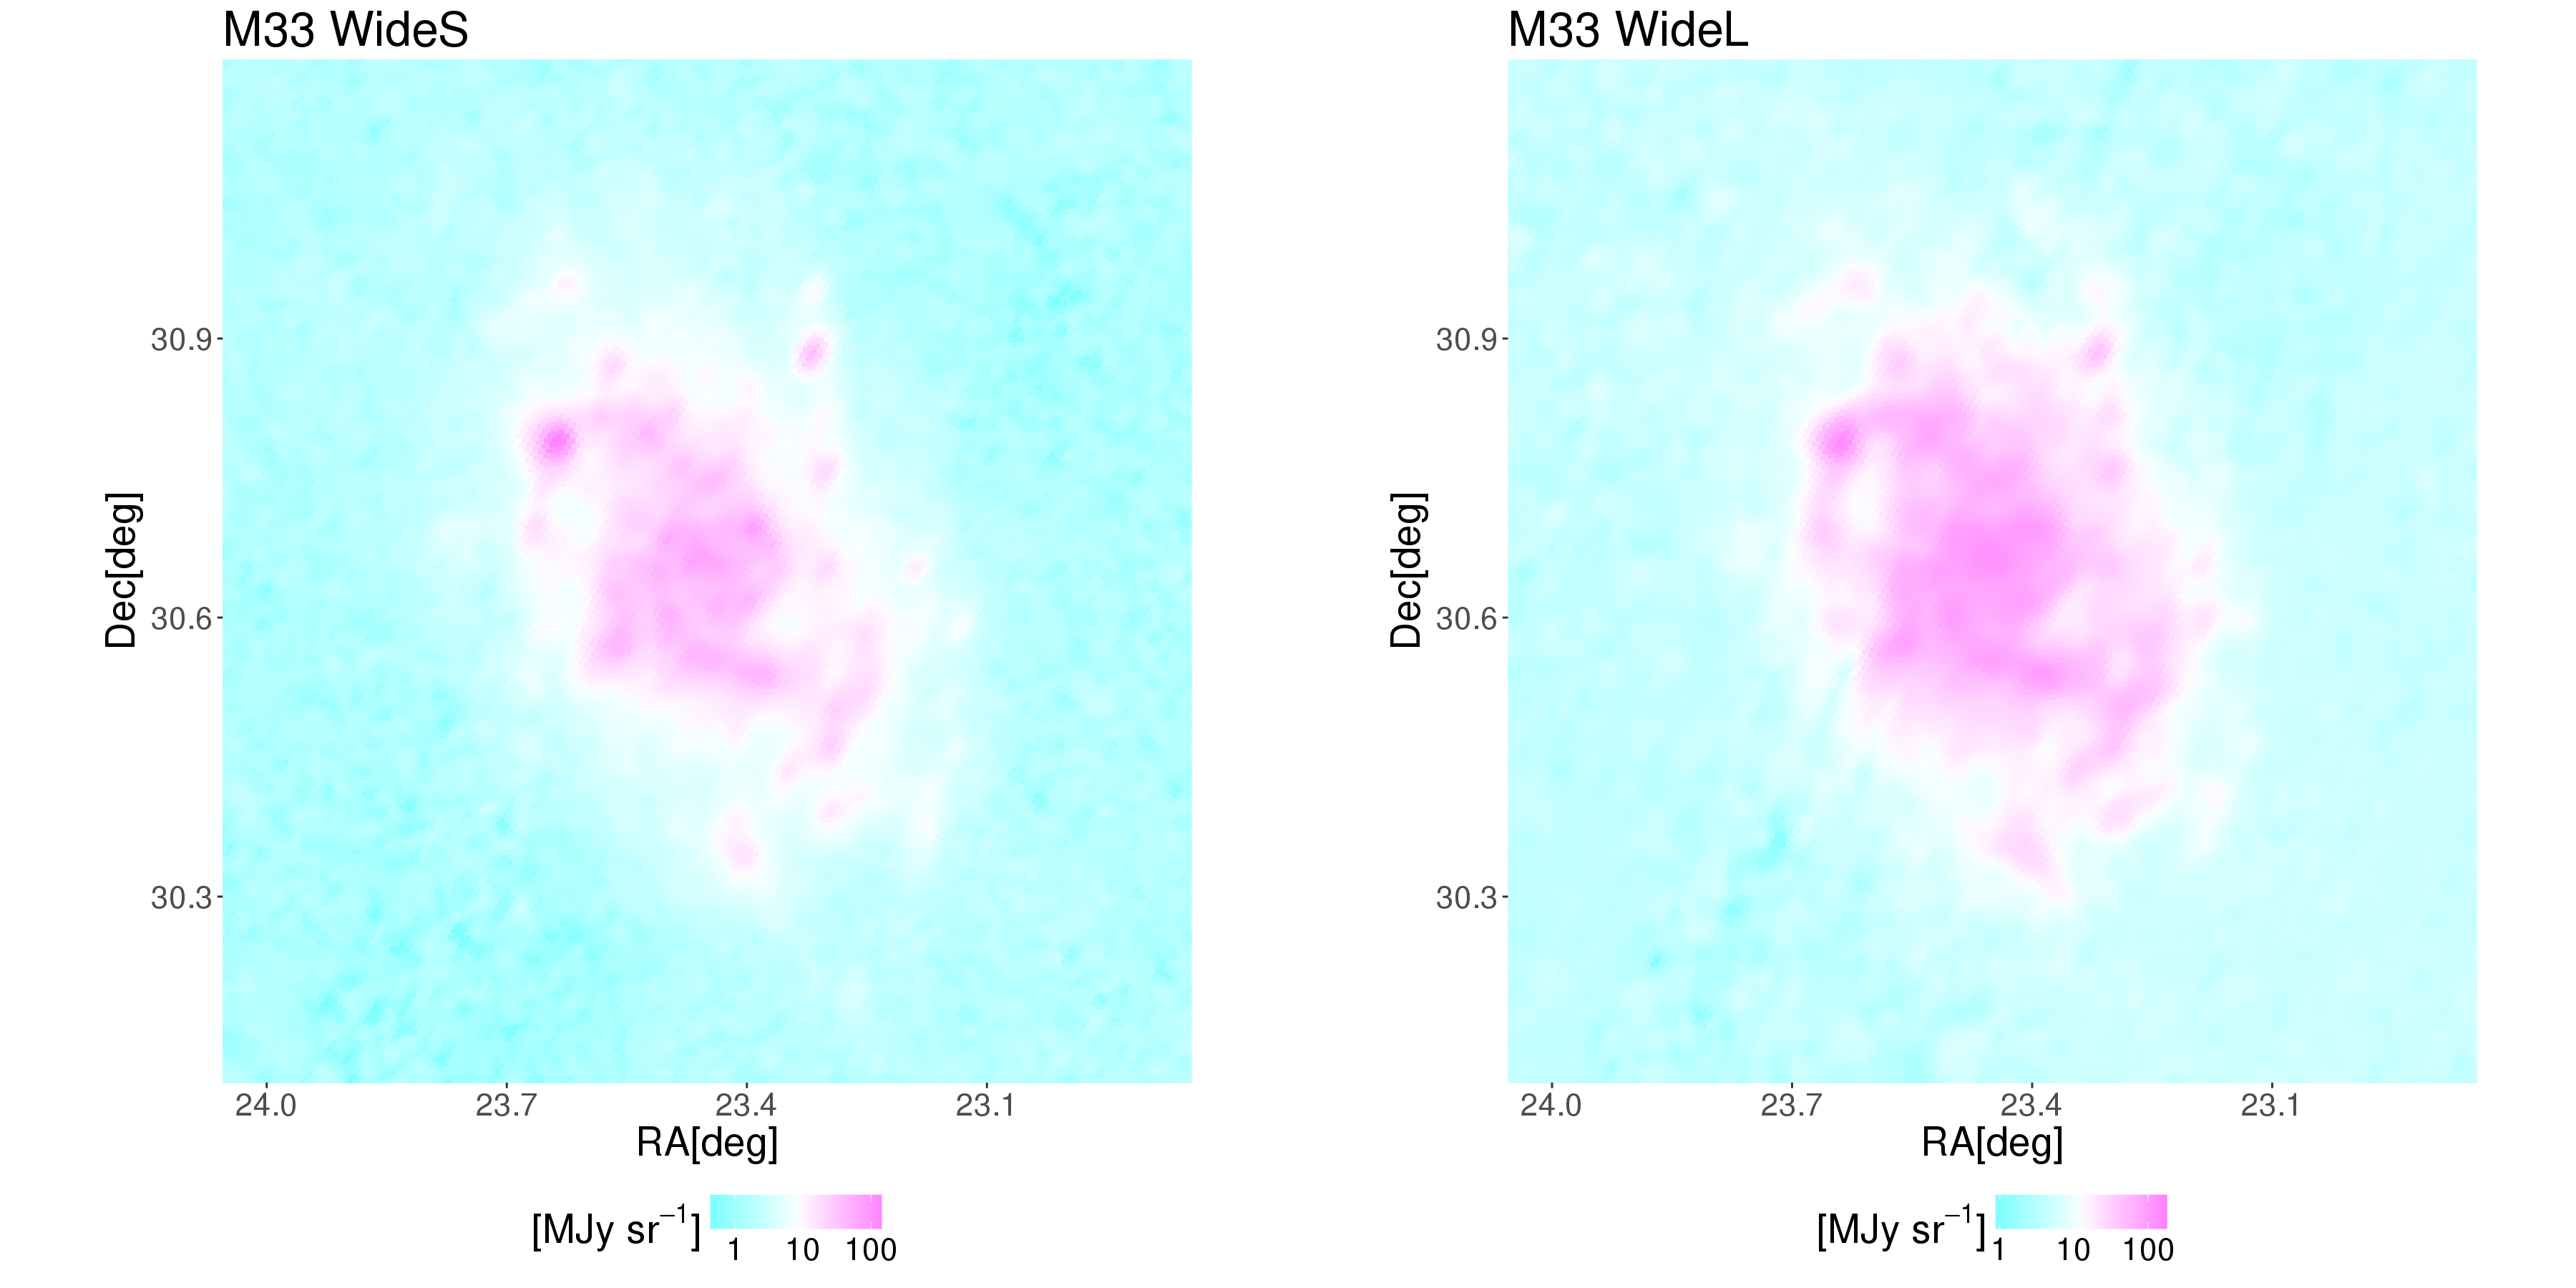
An update of AKARI FIR all-sky intensity images
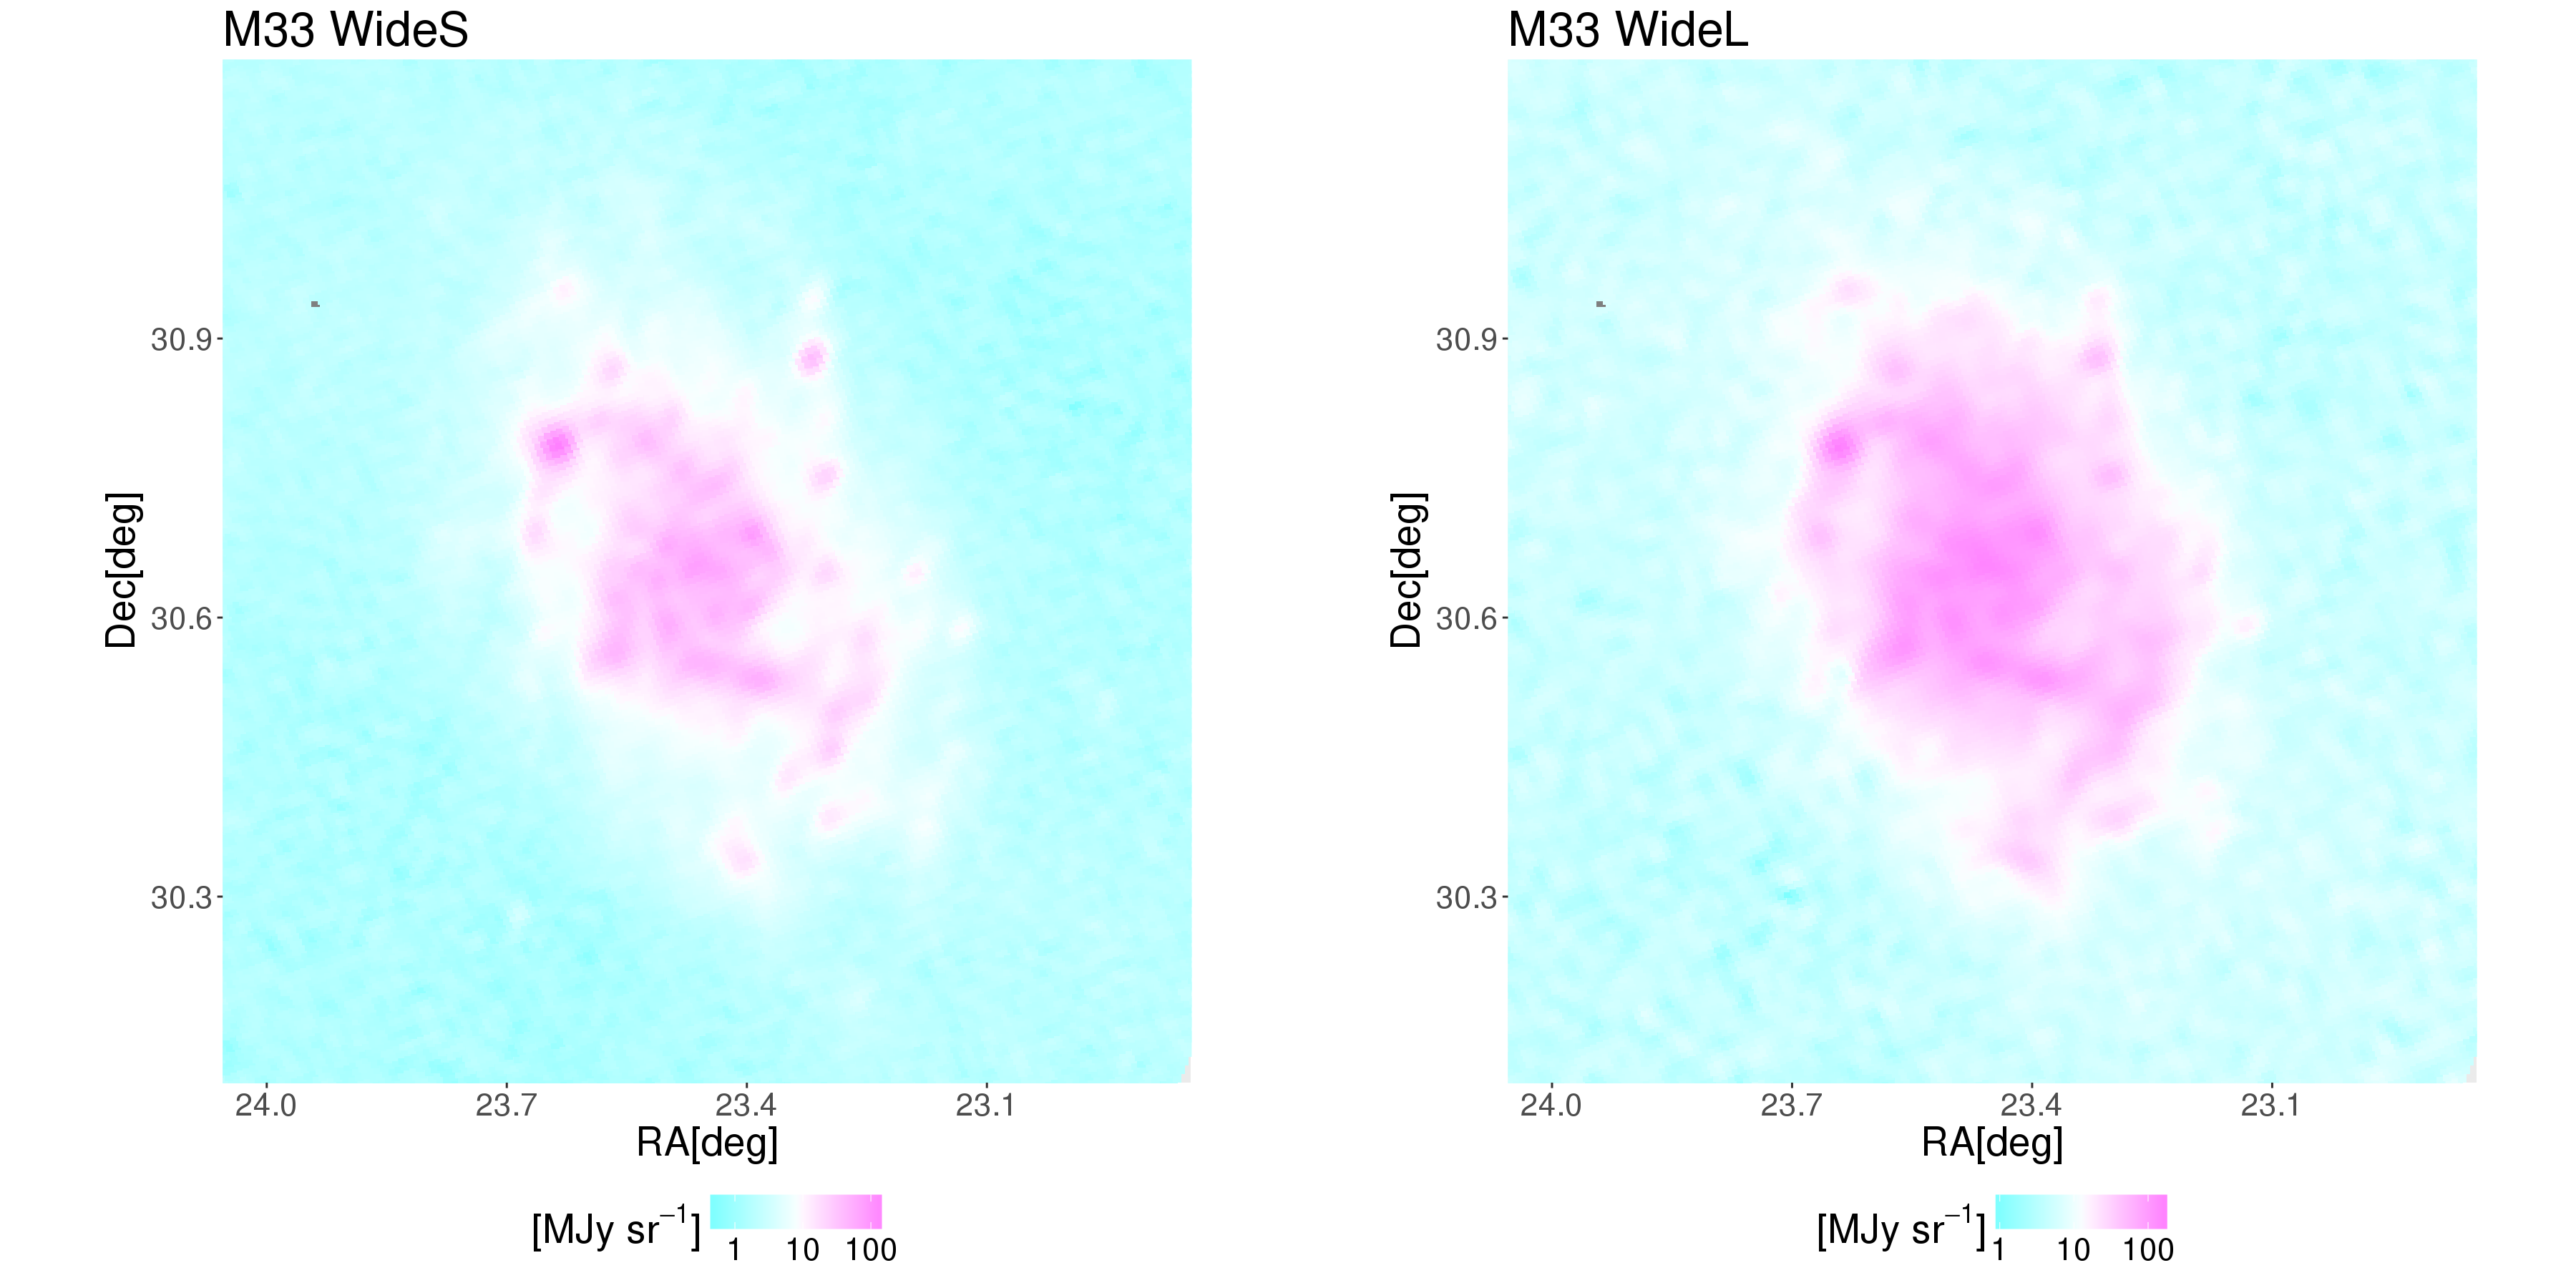
Dust map evaluation
- \(\beta\): refer Planck data (resolution: \(30'\))
- Intensity ratio between 90\(\mu\)m and 140\(\mu\)m \(\to\) \(T_{col}\)
- \(T_{col}\), \(I_{90\mu m}\) \(\to\) \(\tau\)
- \(T_{col}\), \(\tau\), \(\beta\) \(\to\) radiance \(\mathcal{R}\)
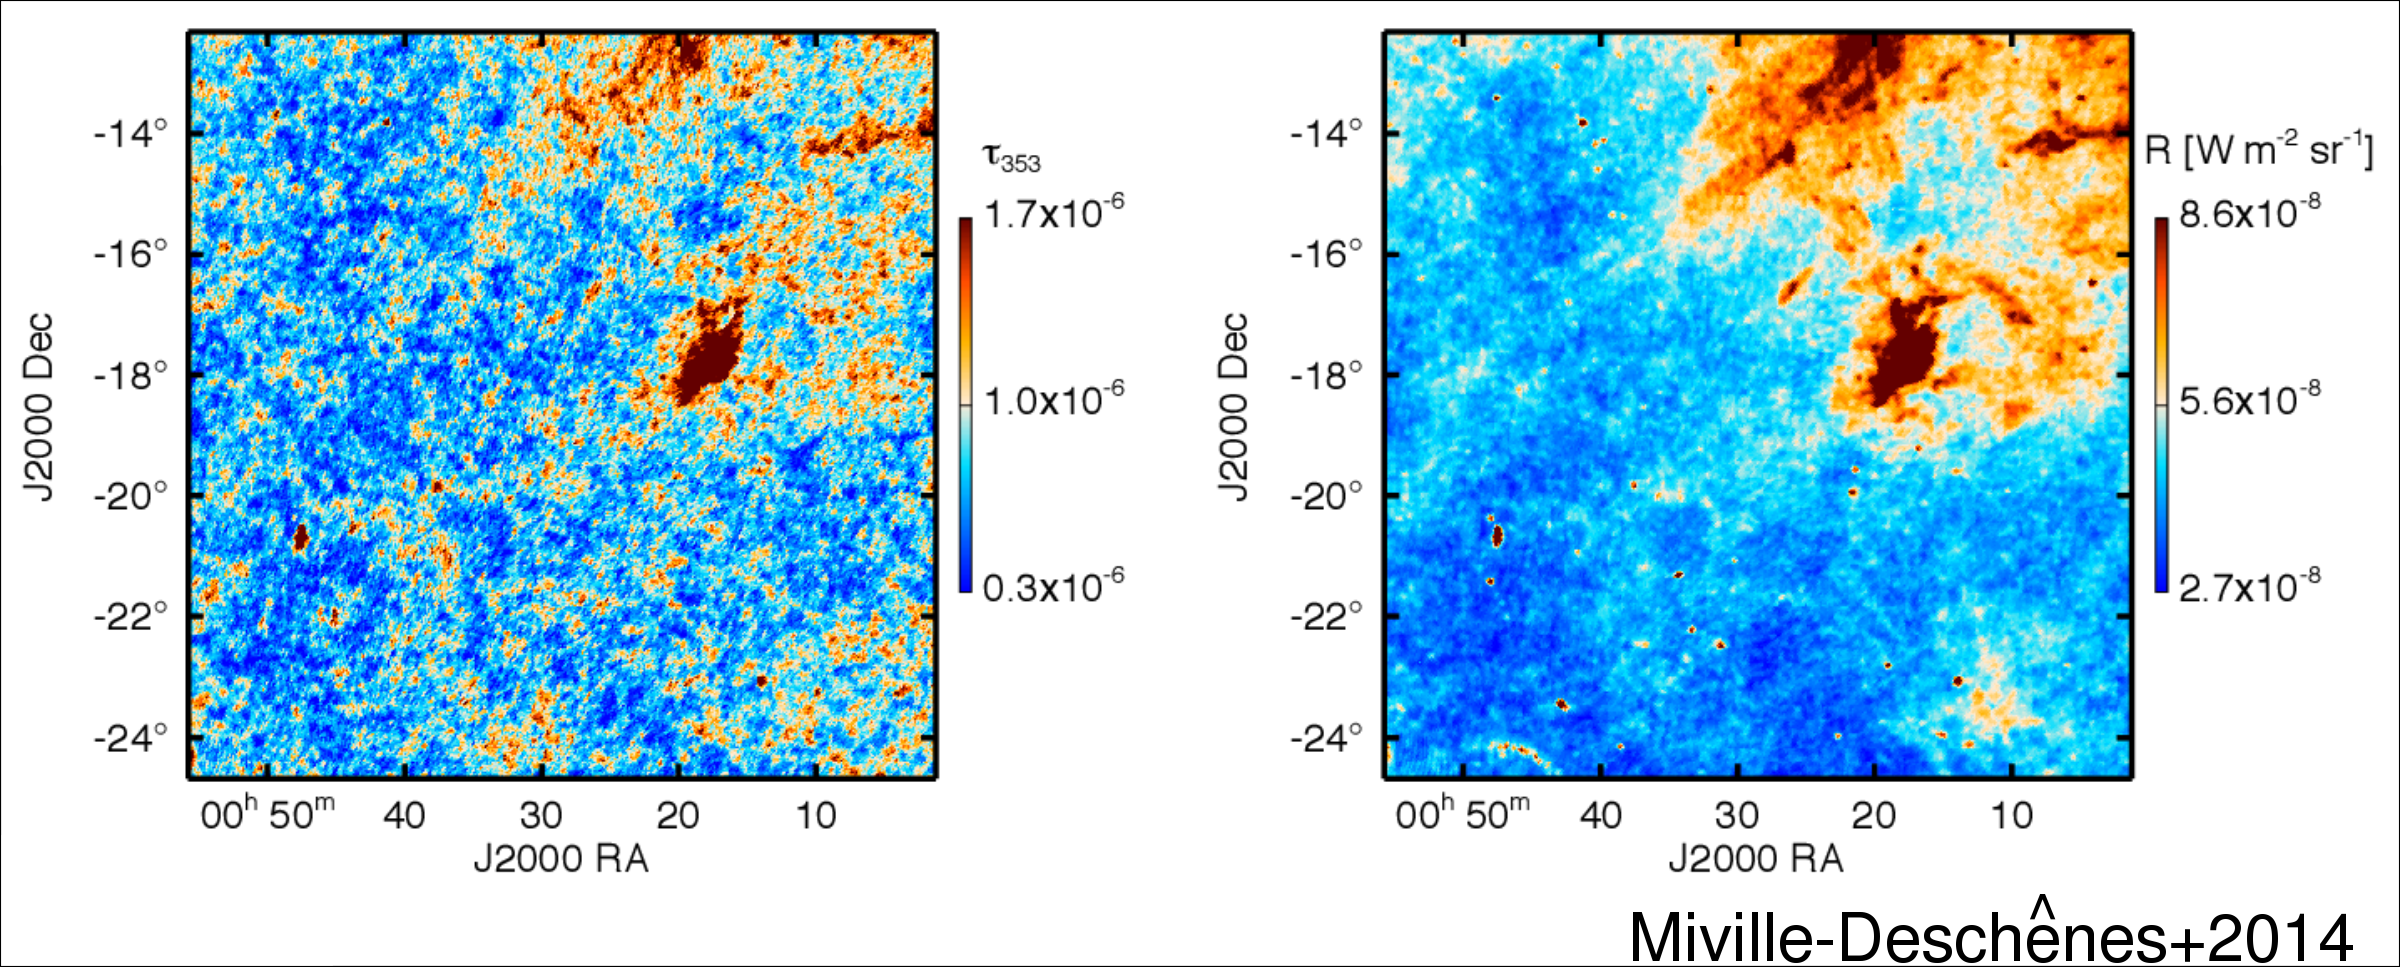
Dust Column Density by Radiance \(\mathcal{R}\)
- Local variation of dust opacity & FIRB fluctuation (!?)
- In the diffuse ISM at high Galactic latitude
- Radiance \(\propto\) dust column, \(\tau\) shows less correlation
- \(\tau\) shows good correlation in molecular clouds
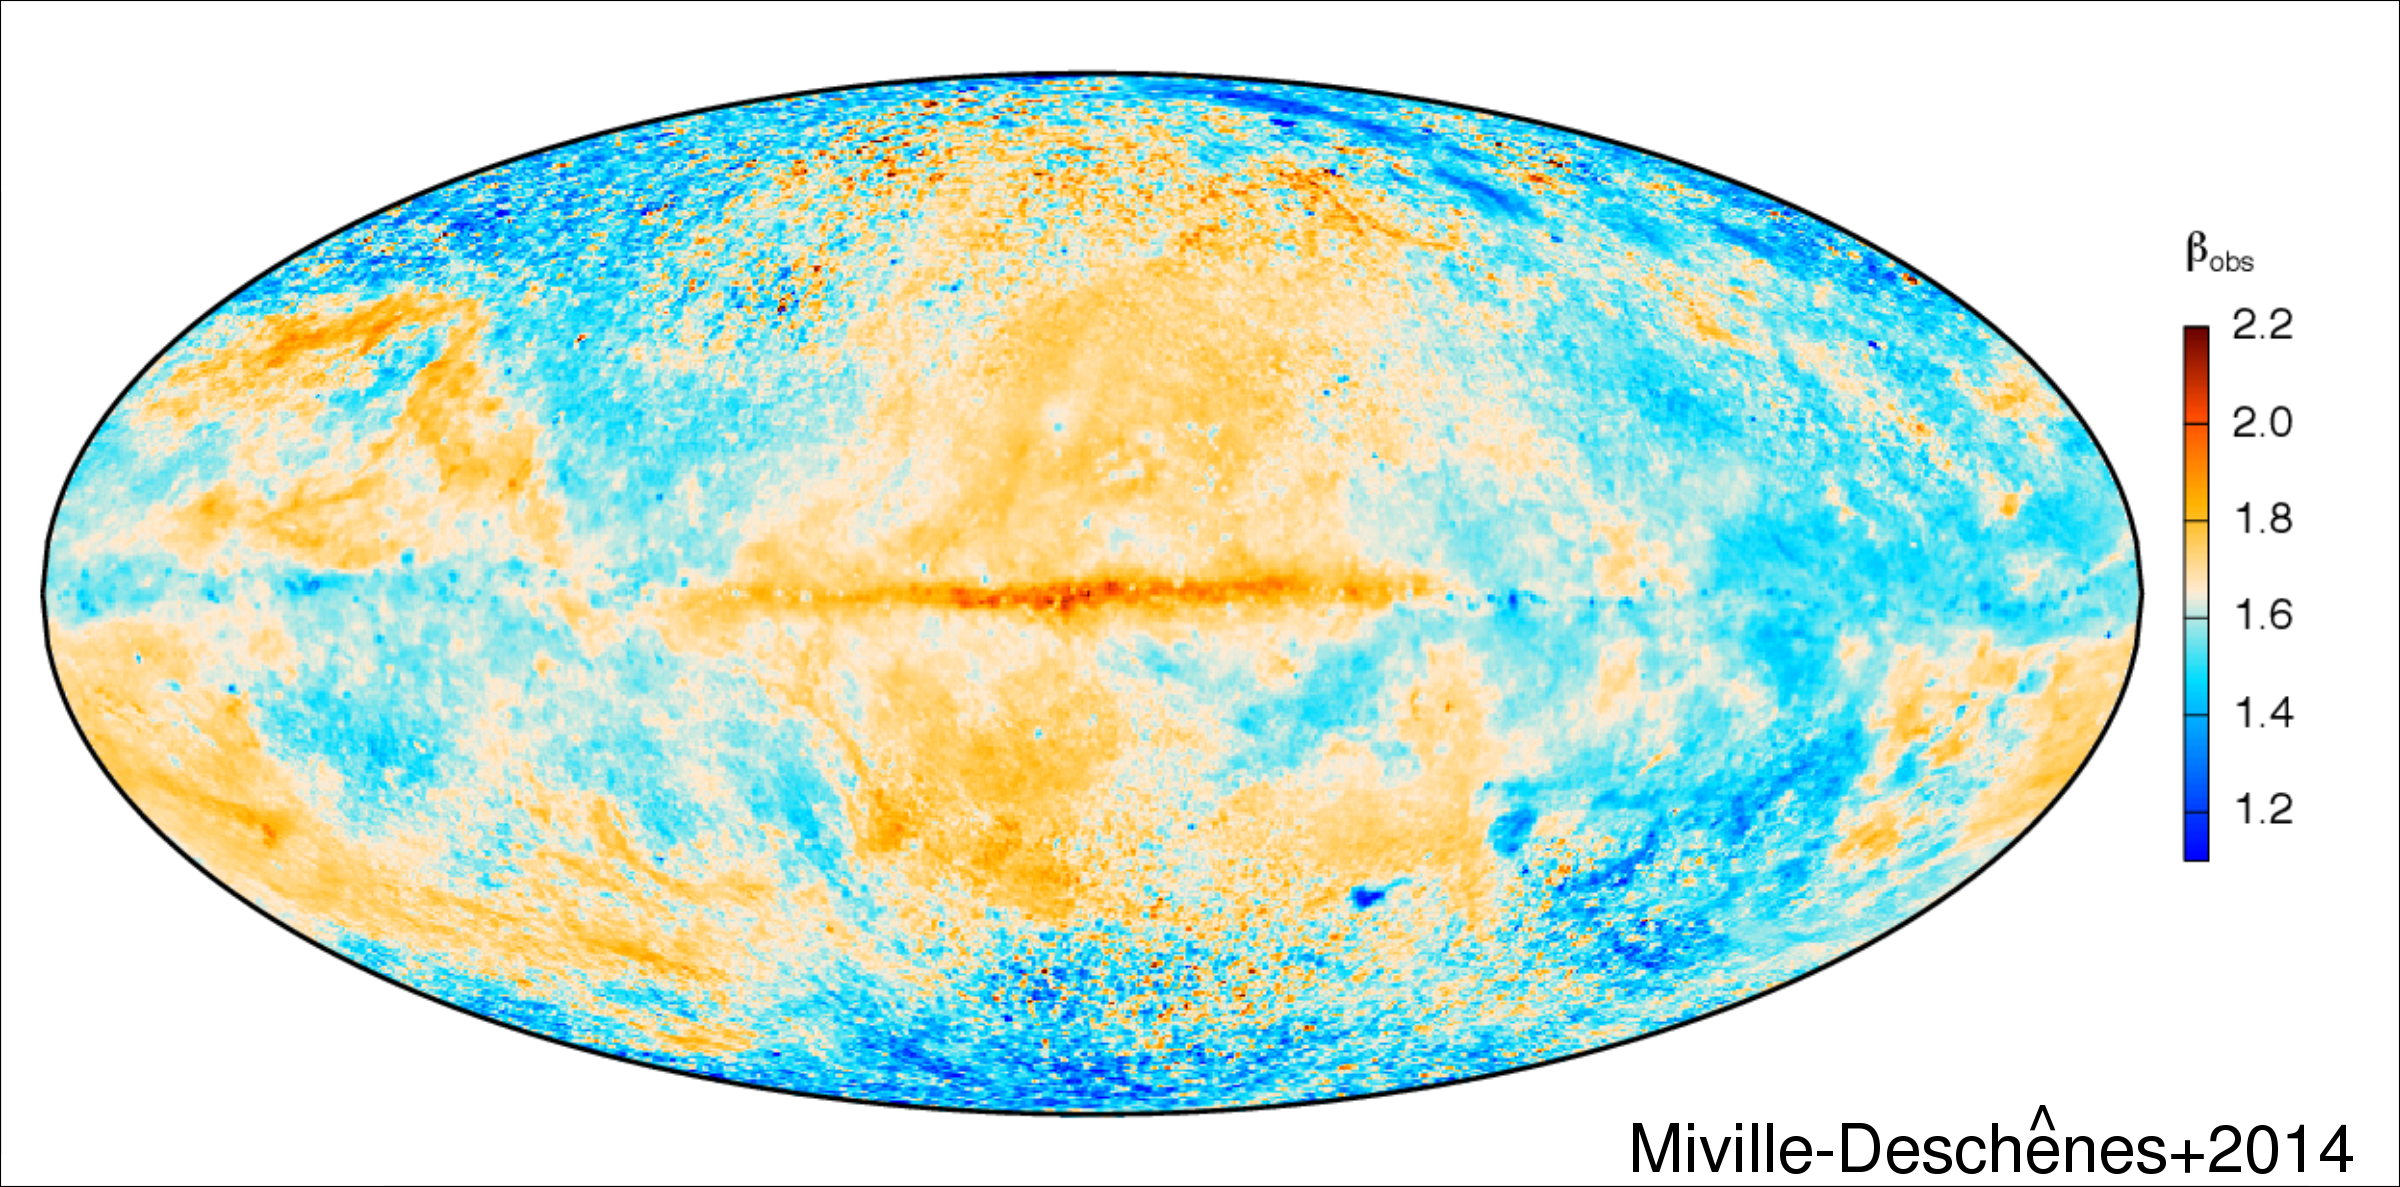
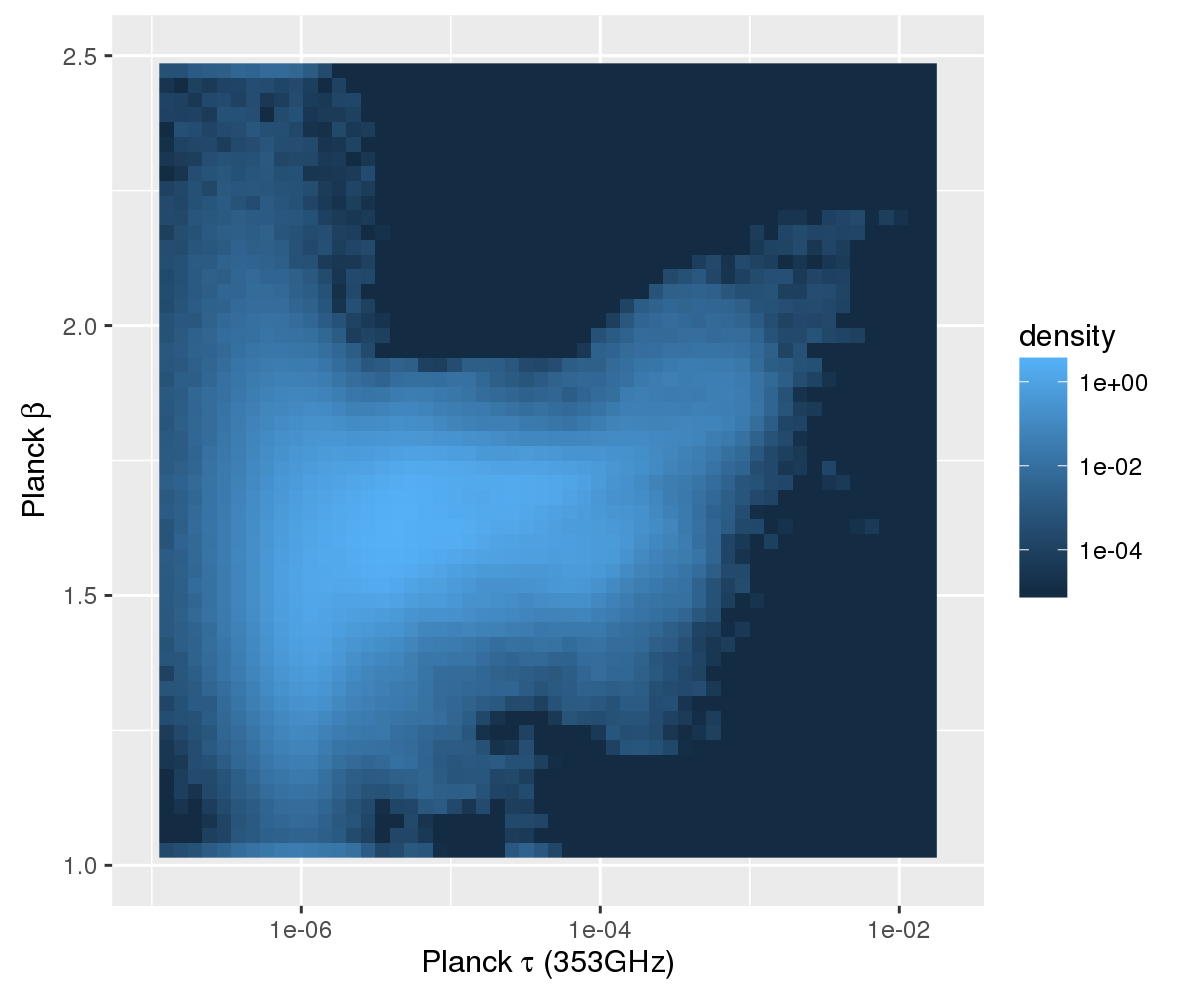
\(\beta\) evaluation by IRAS+Planck
- Fitting with \(30'\) spatial resolution including \(\beta\)
- \(T_{col}\ \&\ \tau\) determination with \(5'\) resolution
- Average \(<\beta>=1.62\)

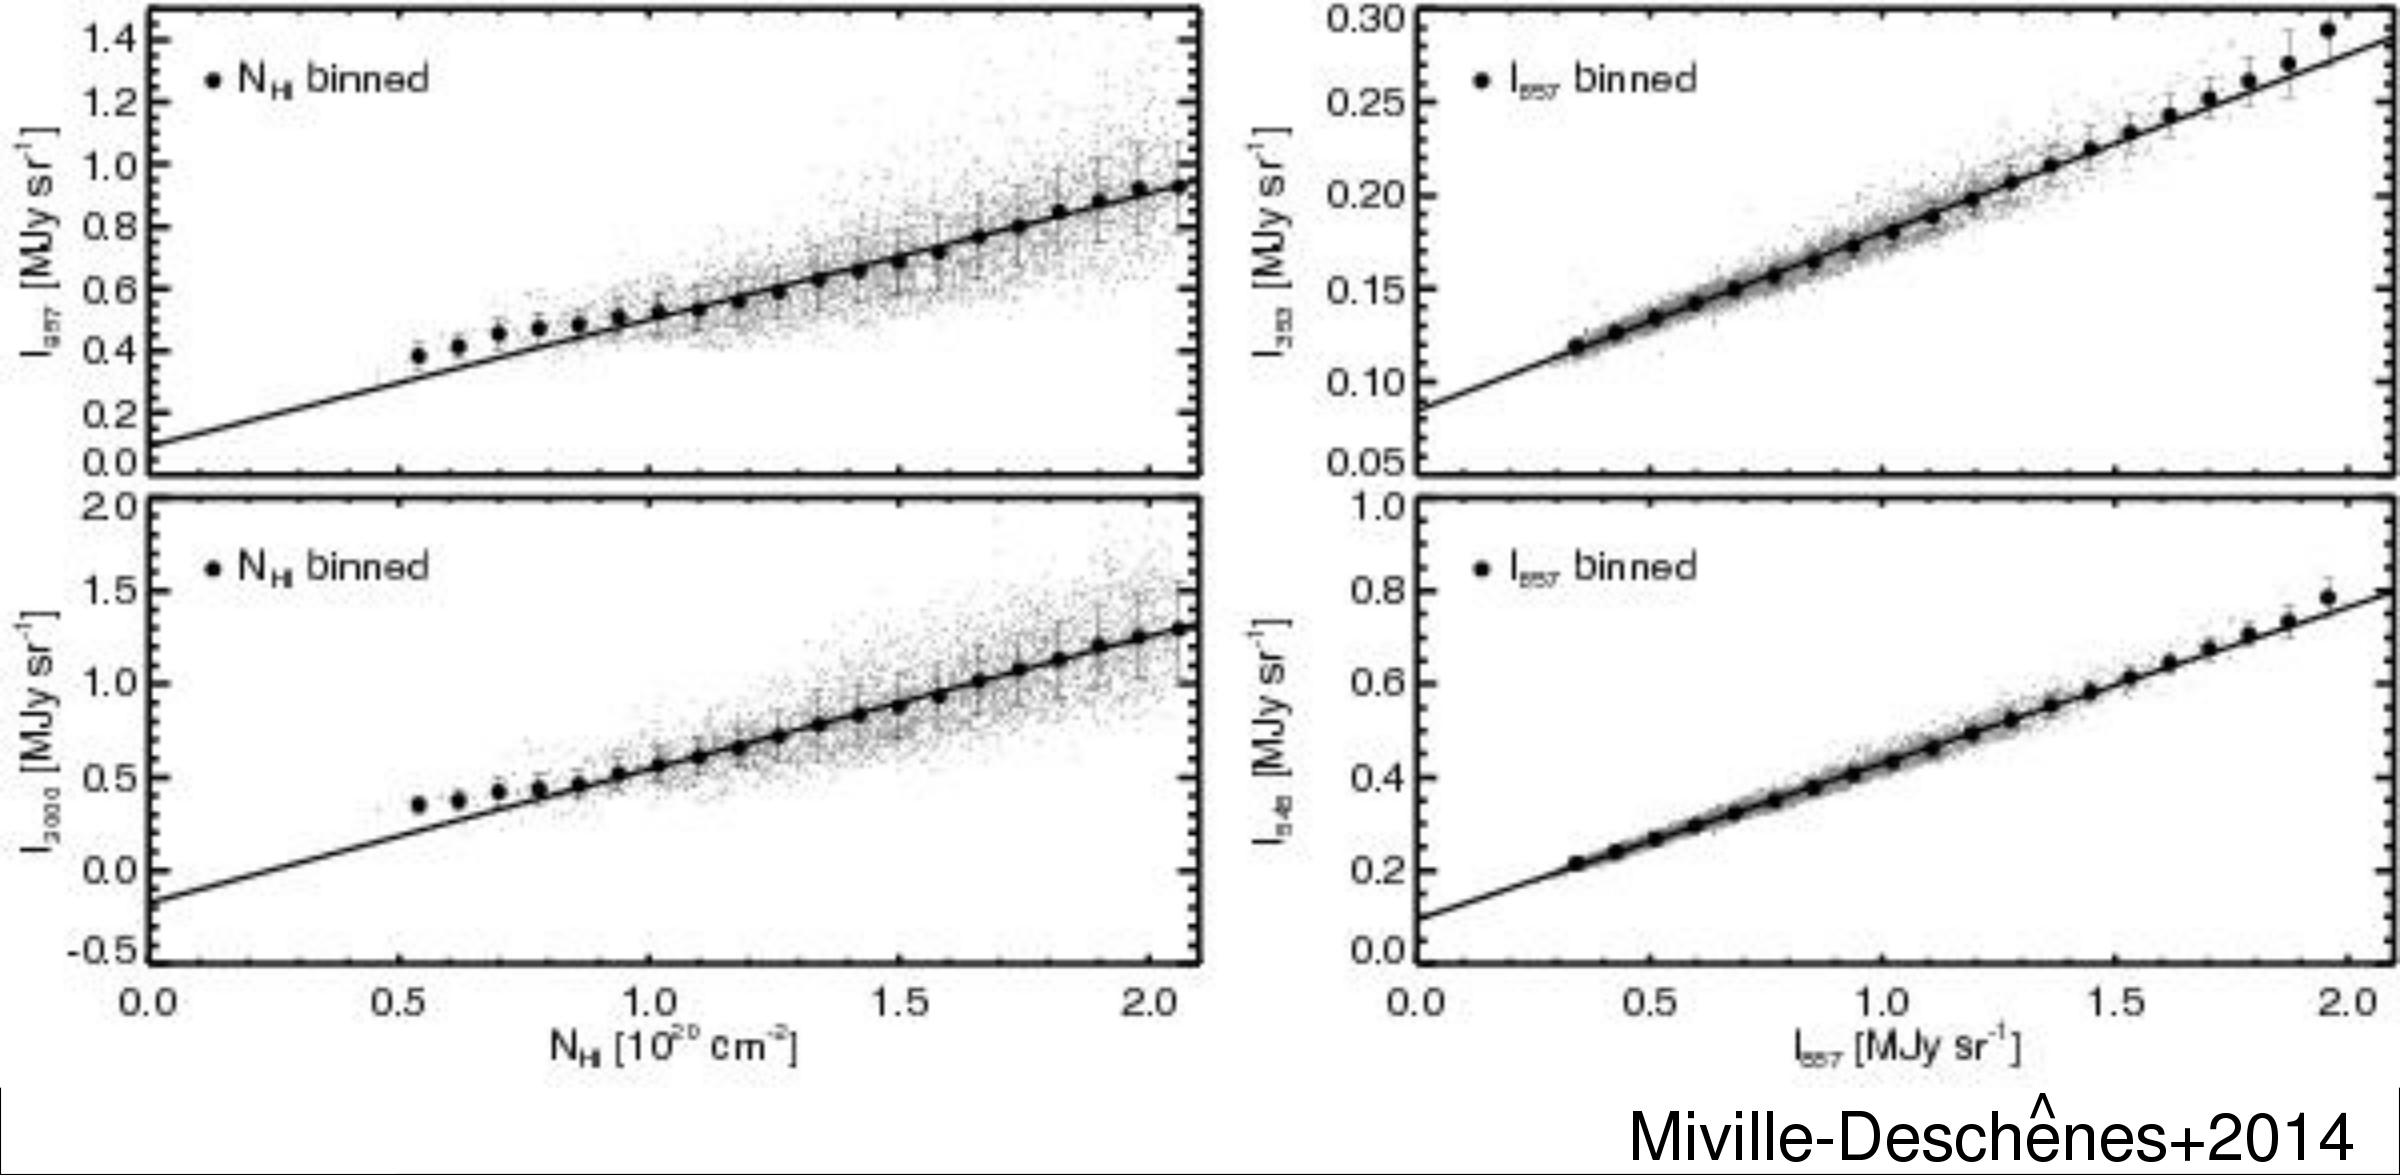
ゼロ点の見積り
- \(N_H\)との相関による方法が一般に用いられている
- Miville-Deschenes+2014の方法を踏襲
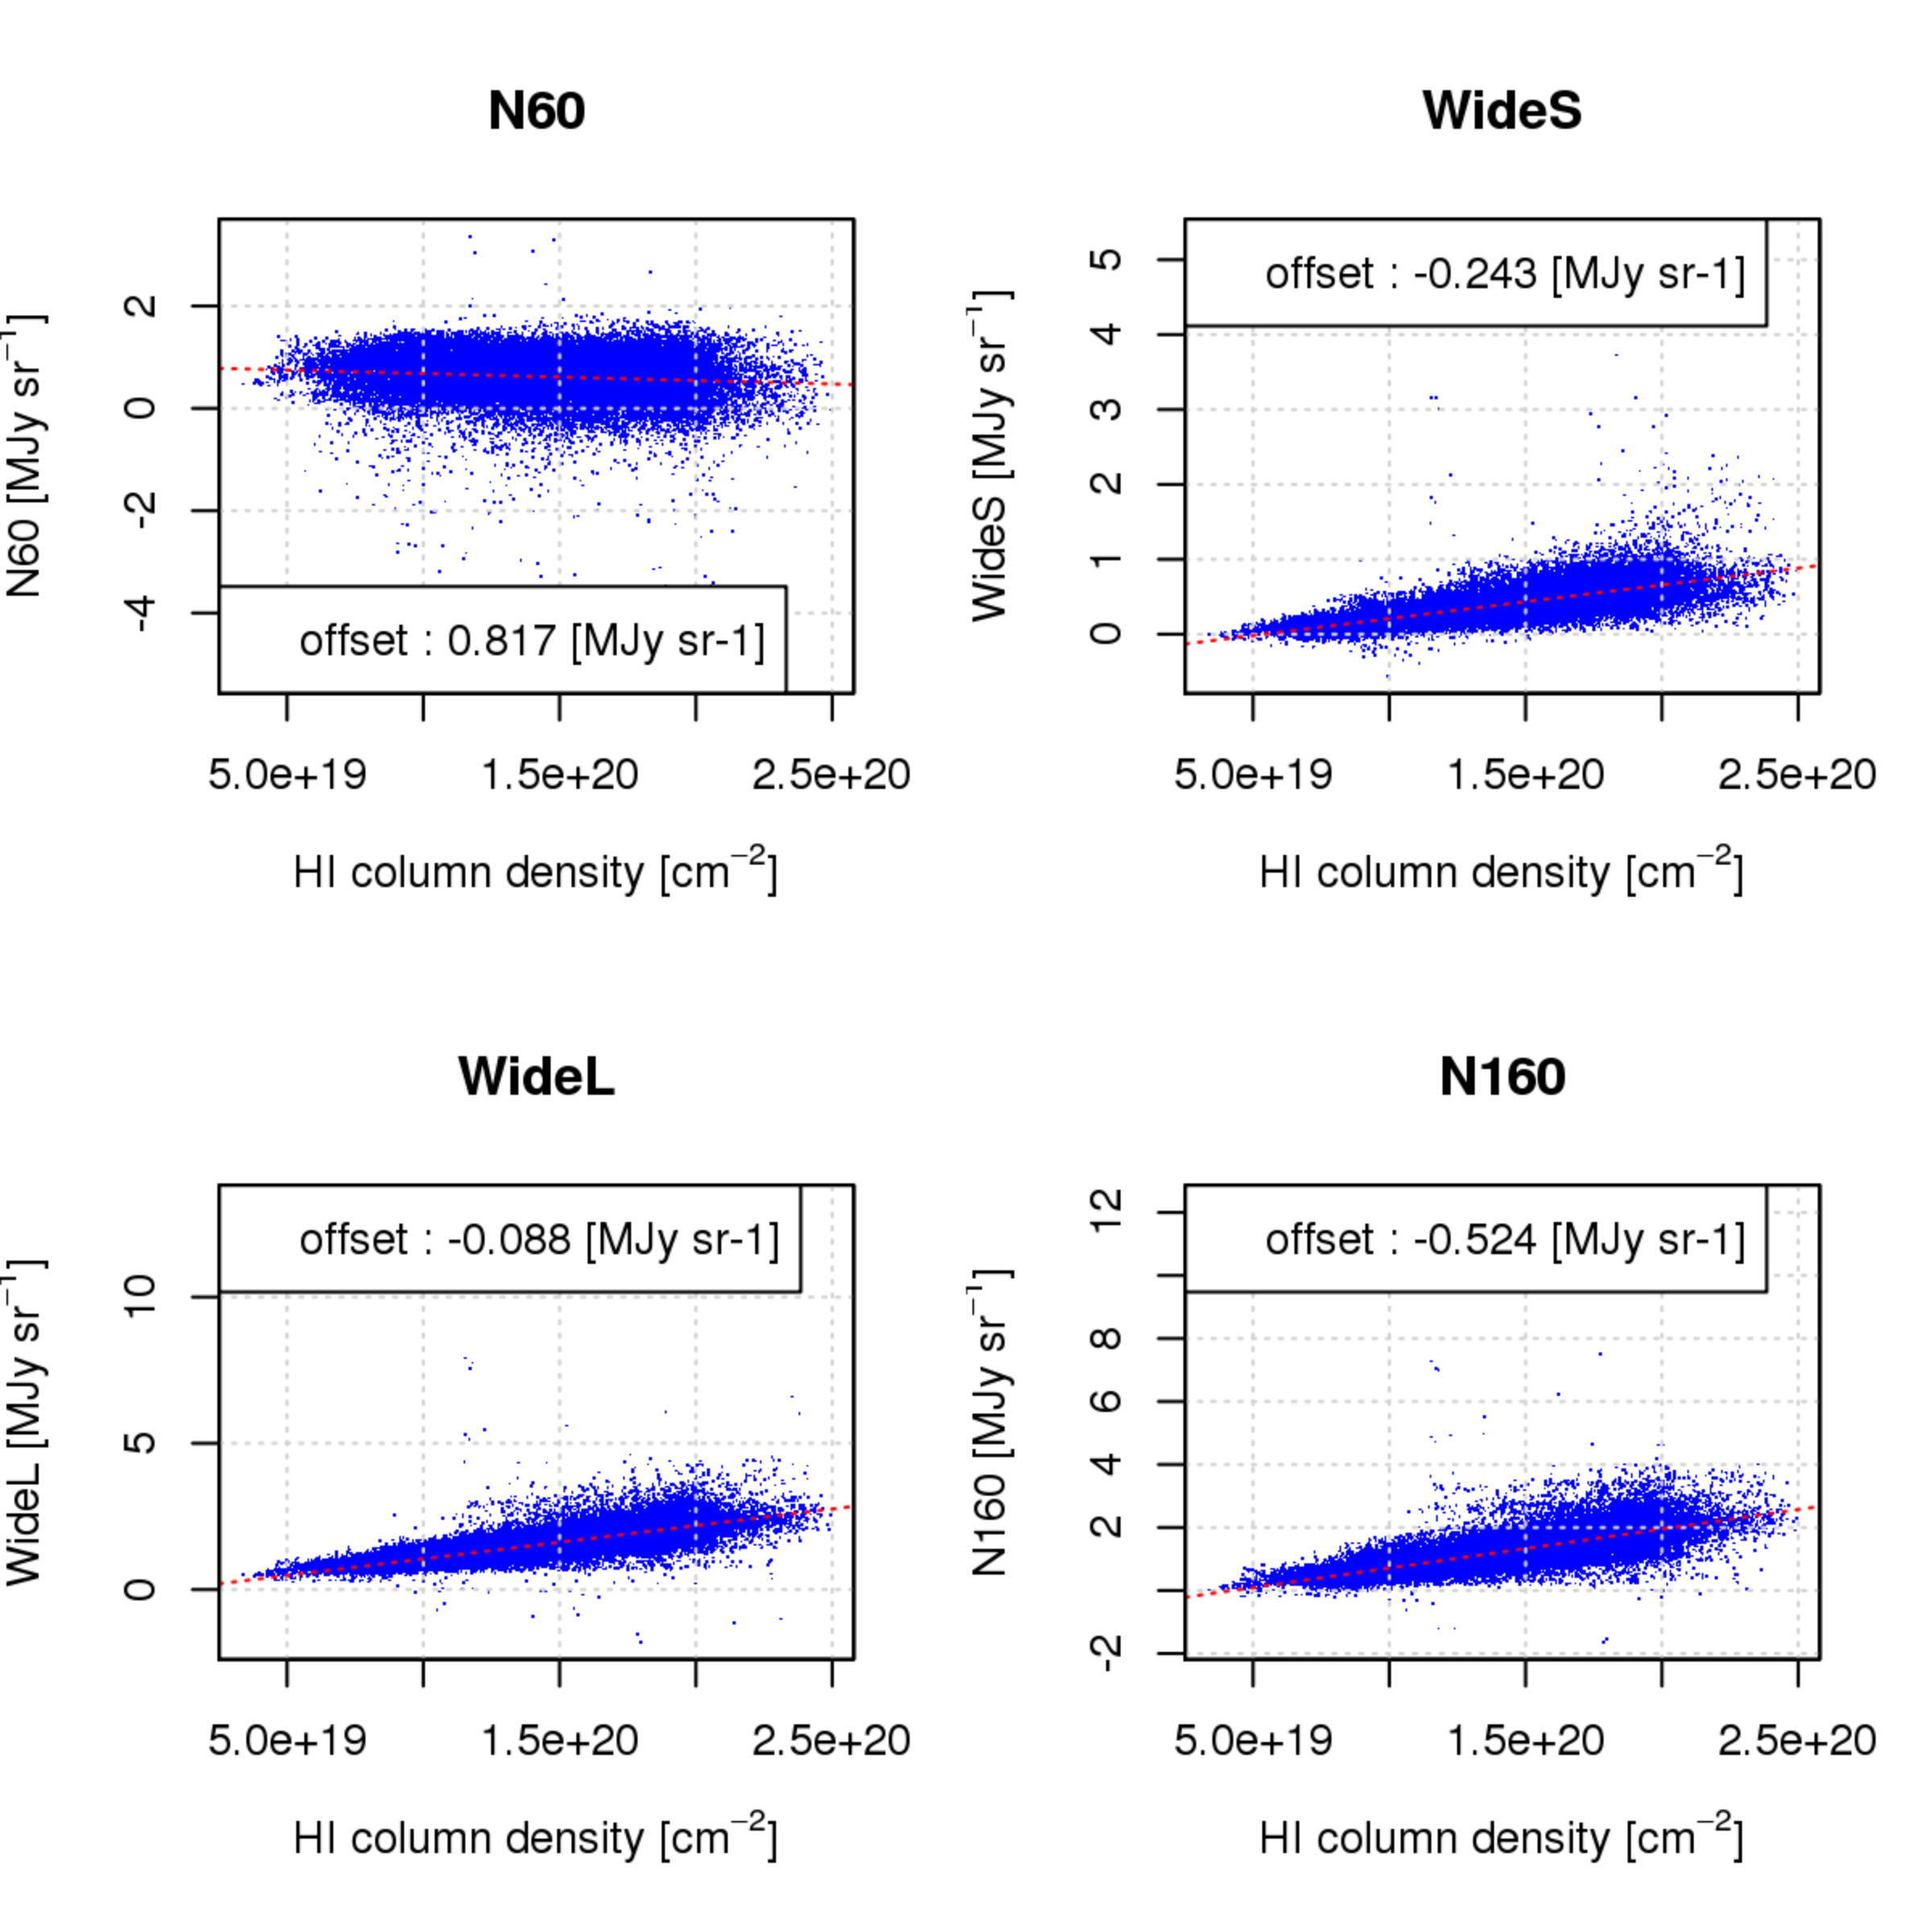
AKARI/FISマップ ゼロ点の見積り
- WideSは固定オフセット値を加えていないことに注意
- それでも全般にイマイチなオフセット量?ともかくこの値を採用
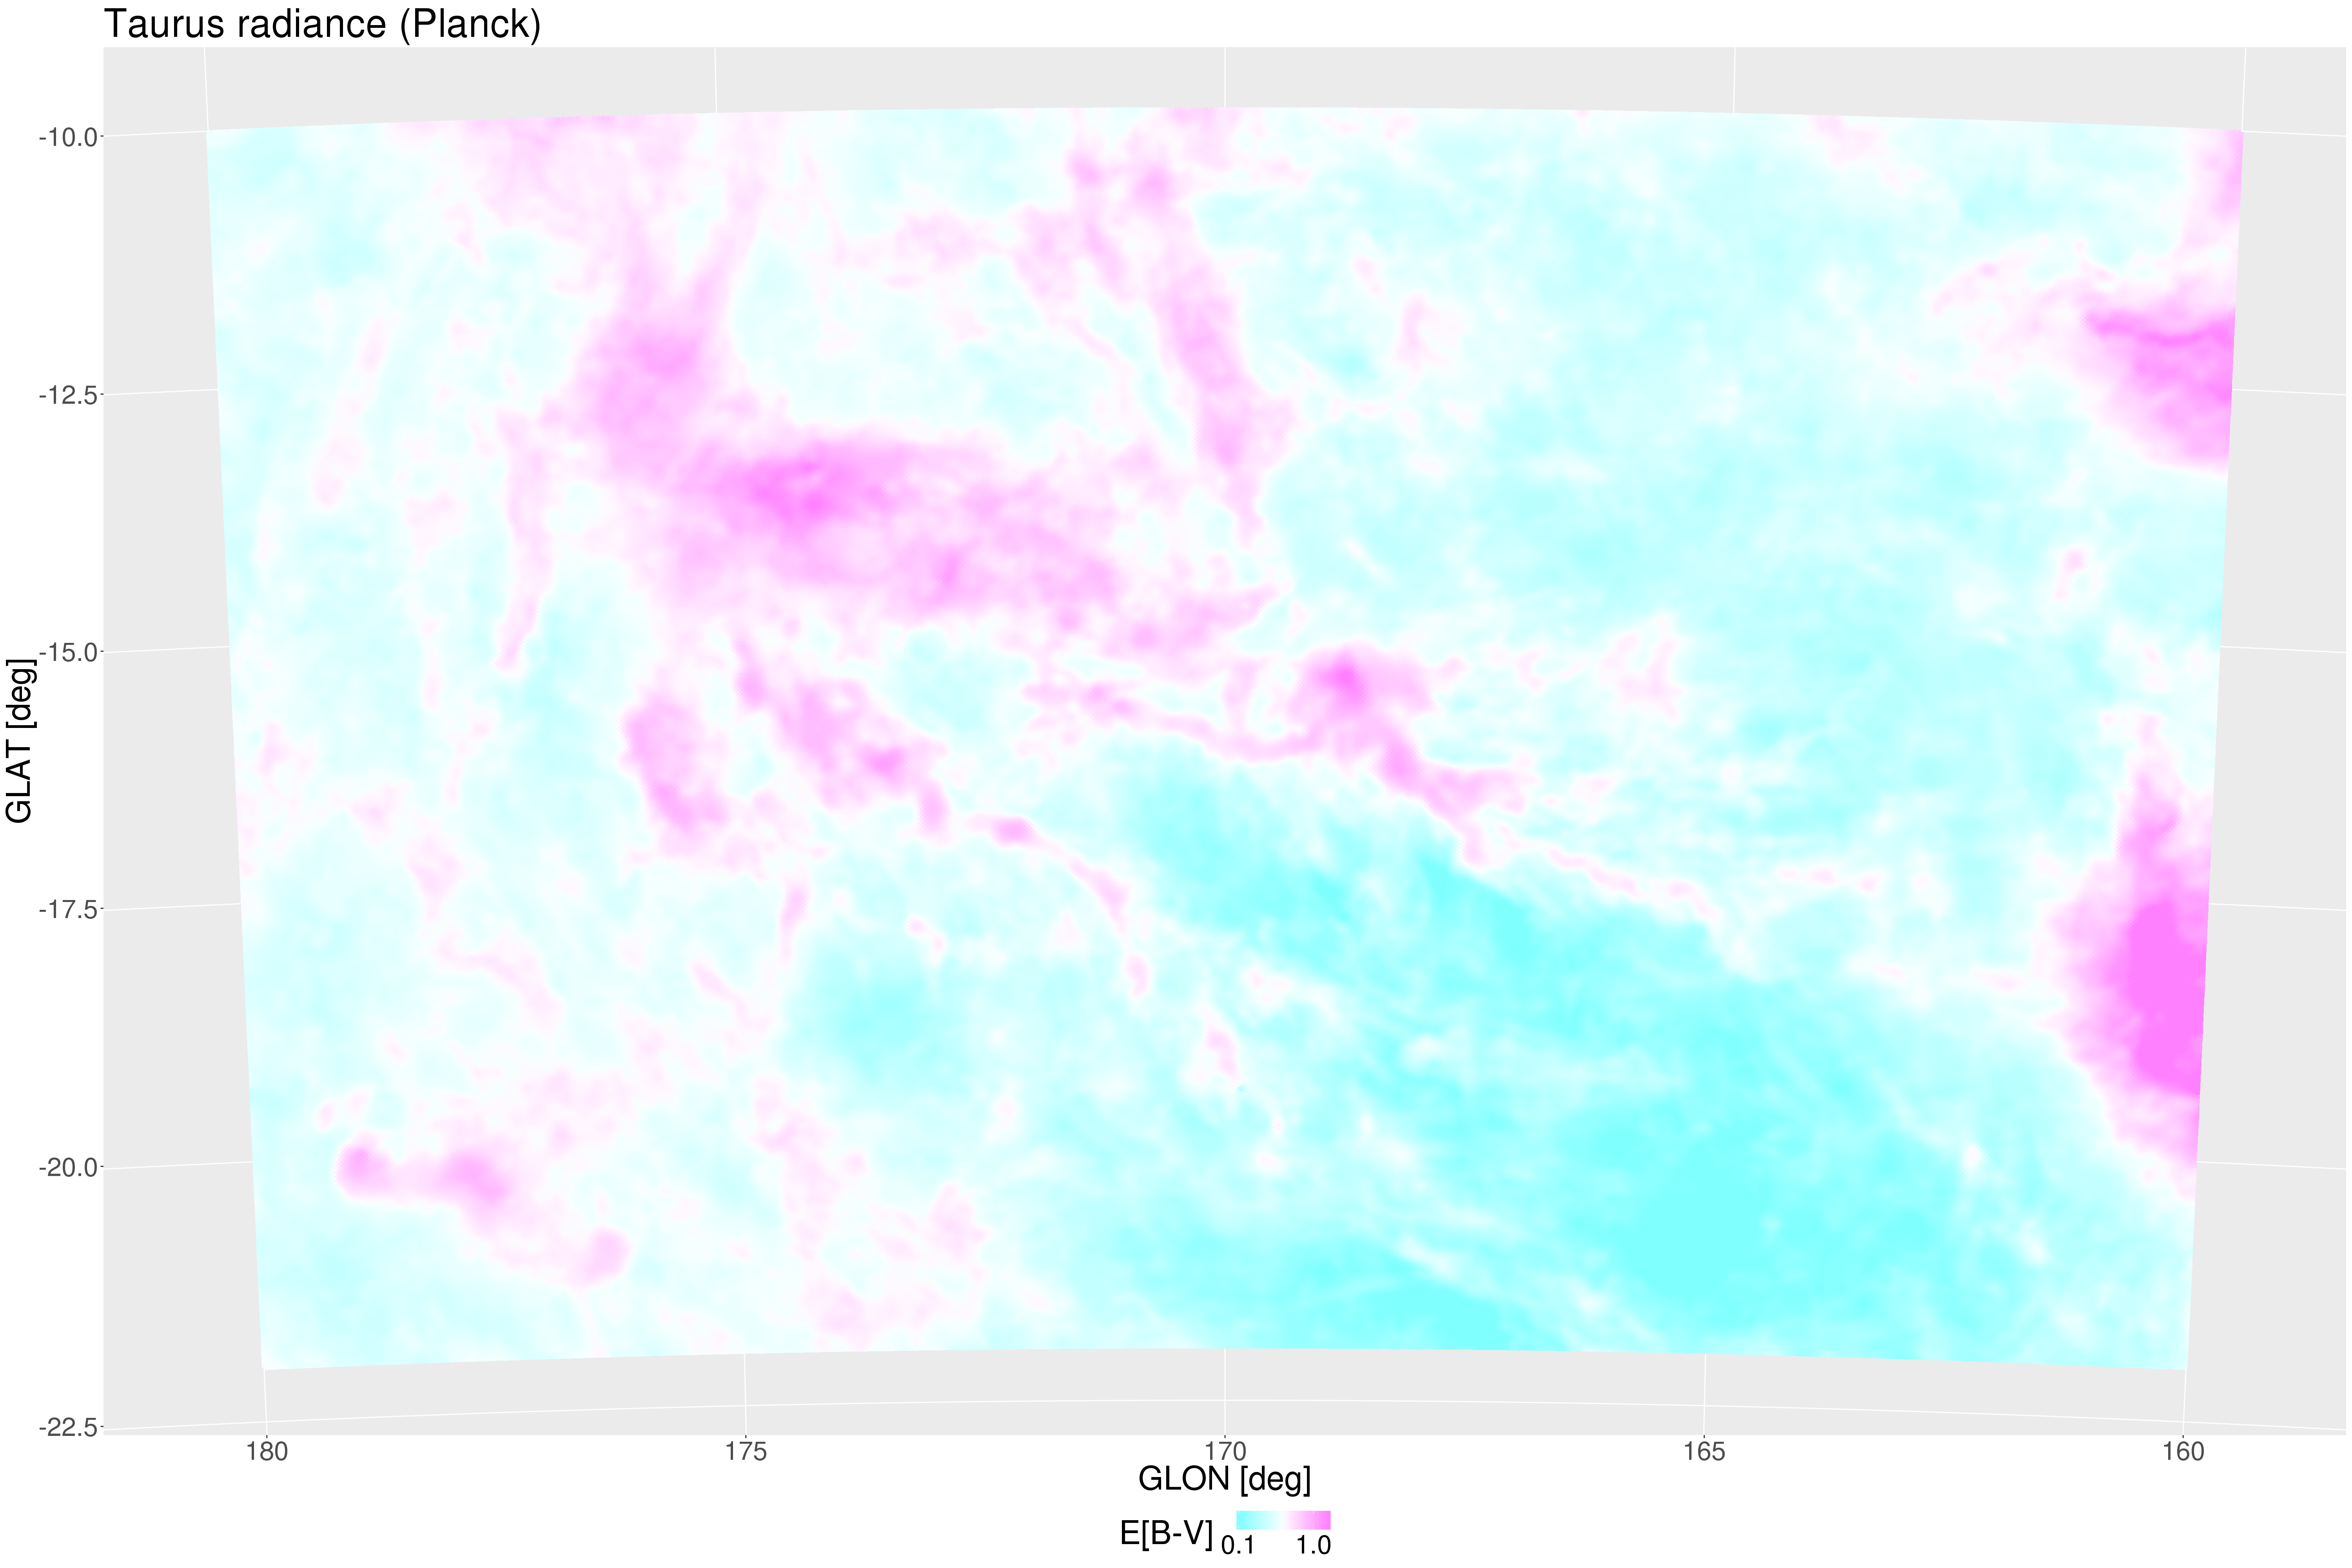
Taurus dust map: Planck
Taurus dust map: AKARI
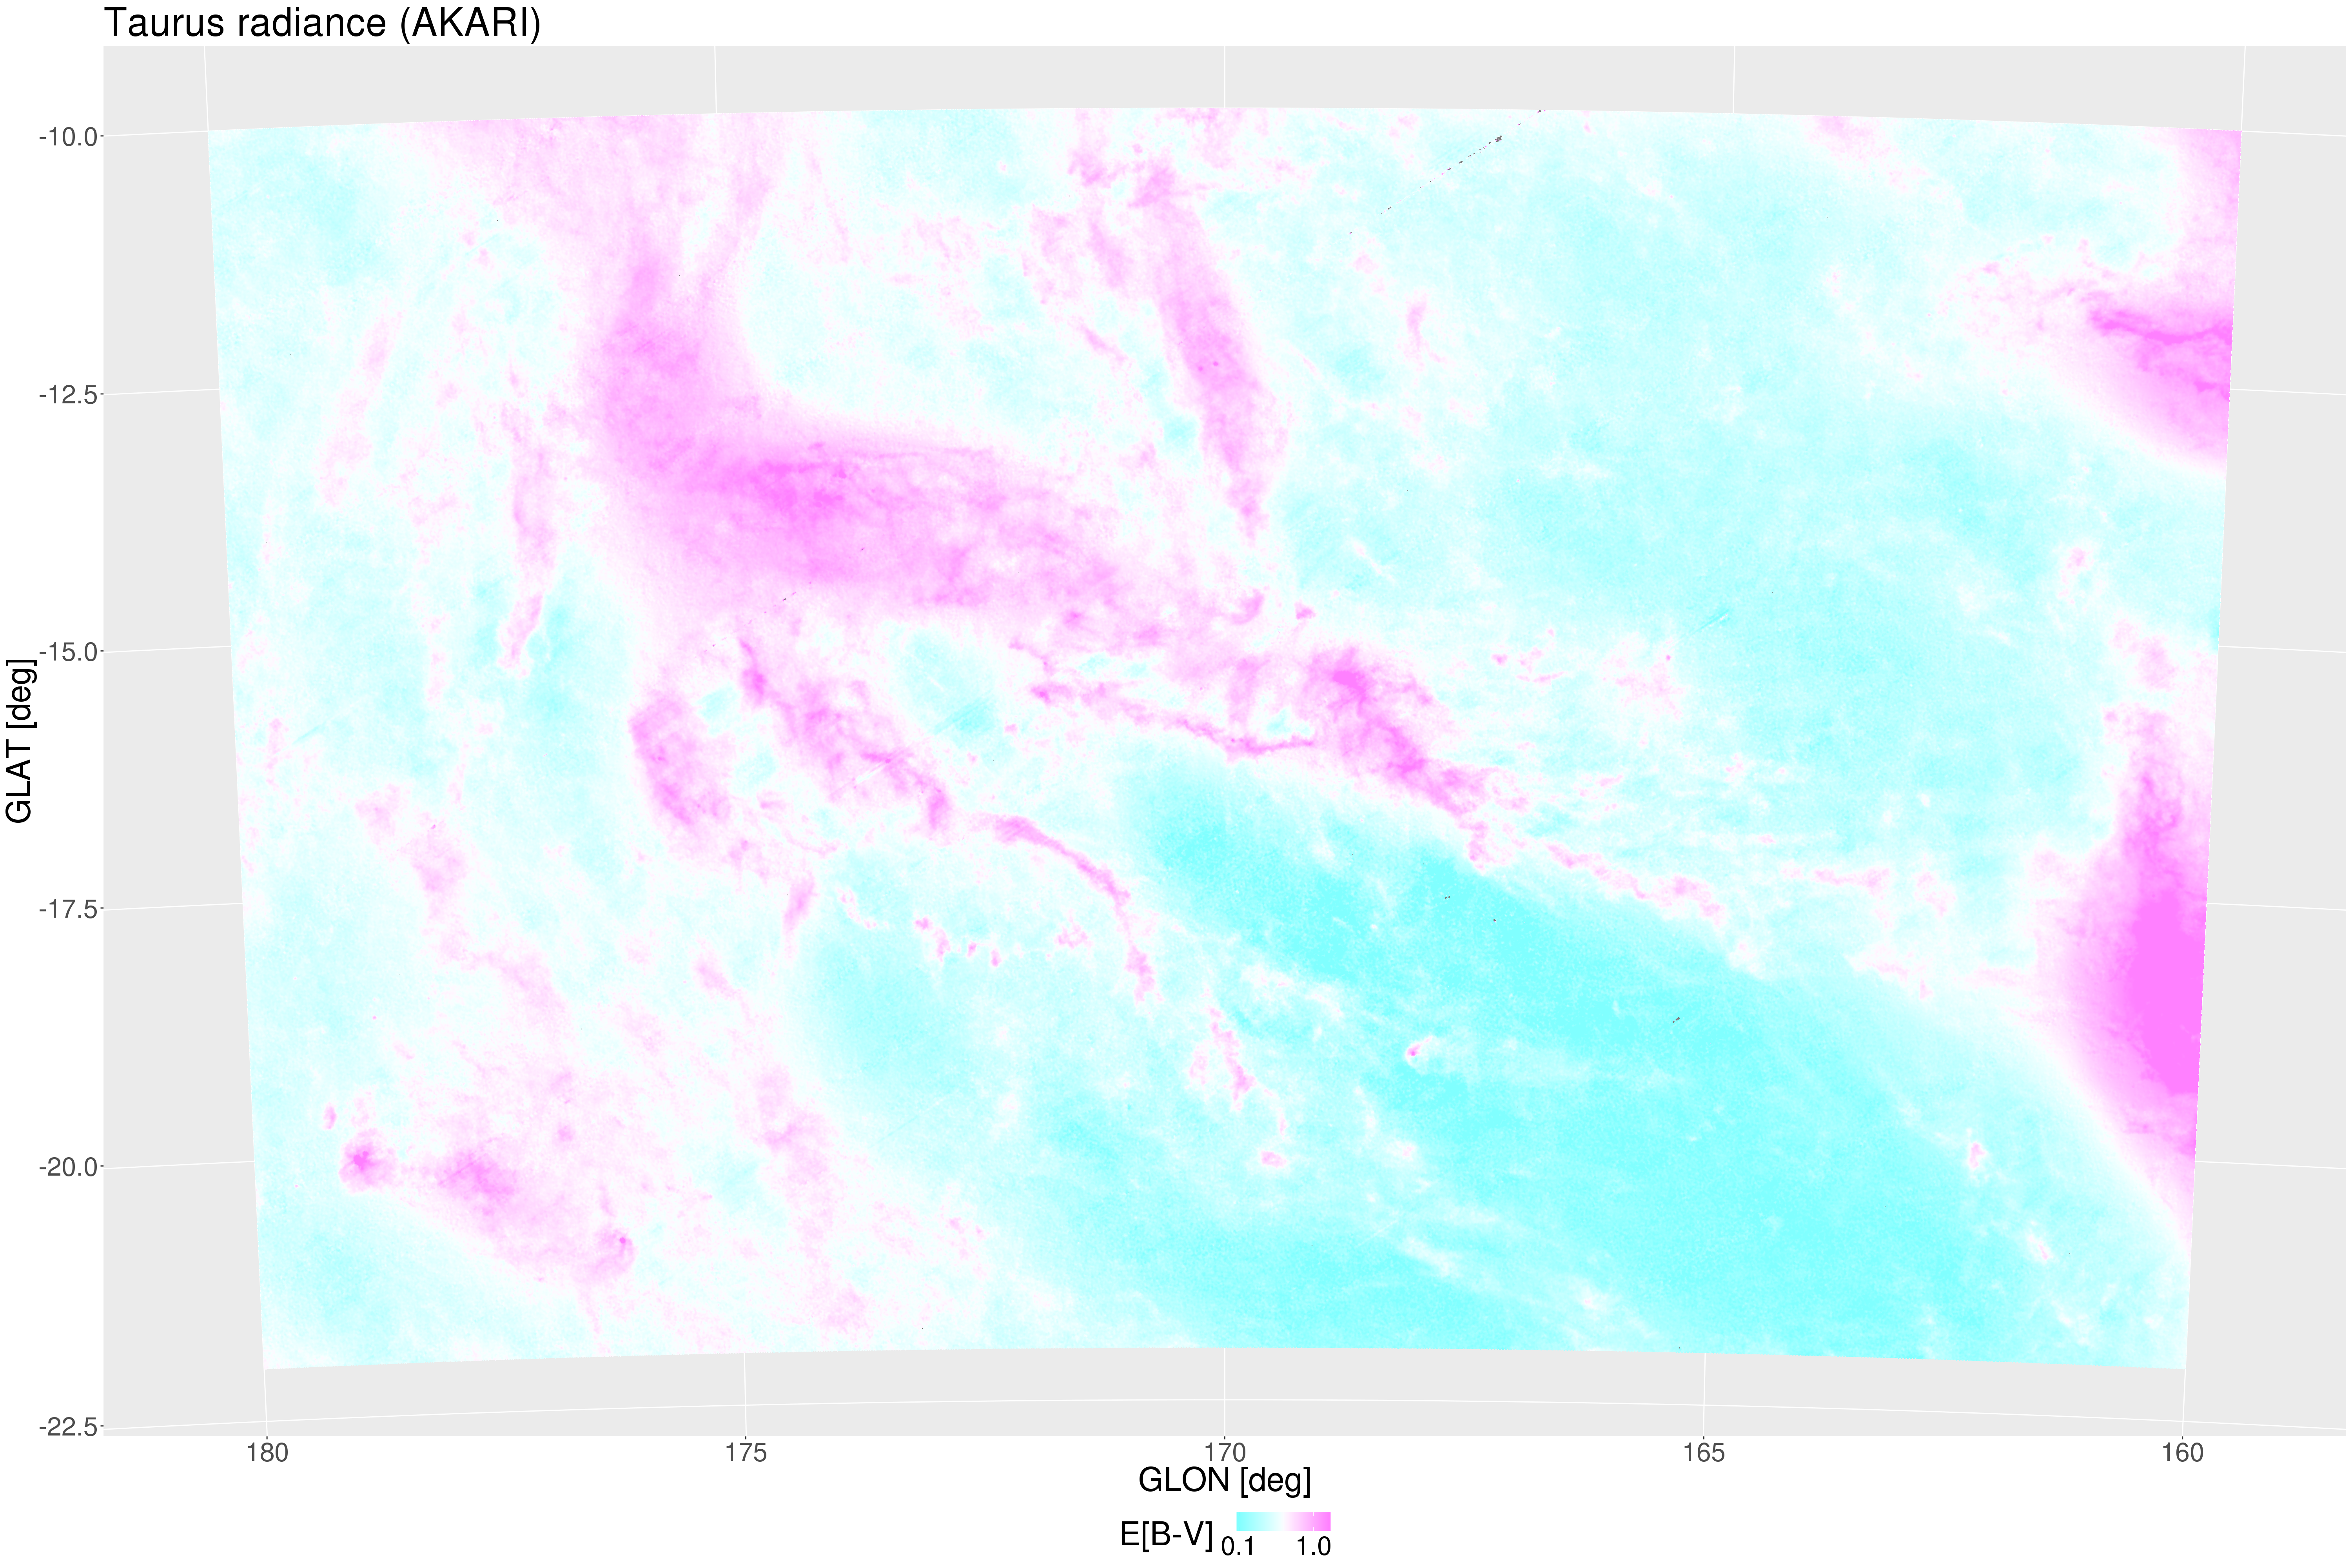
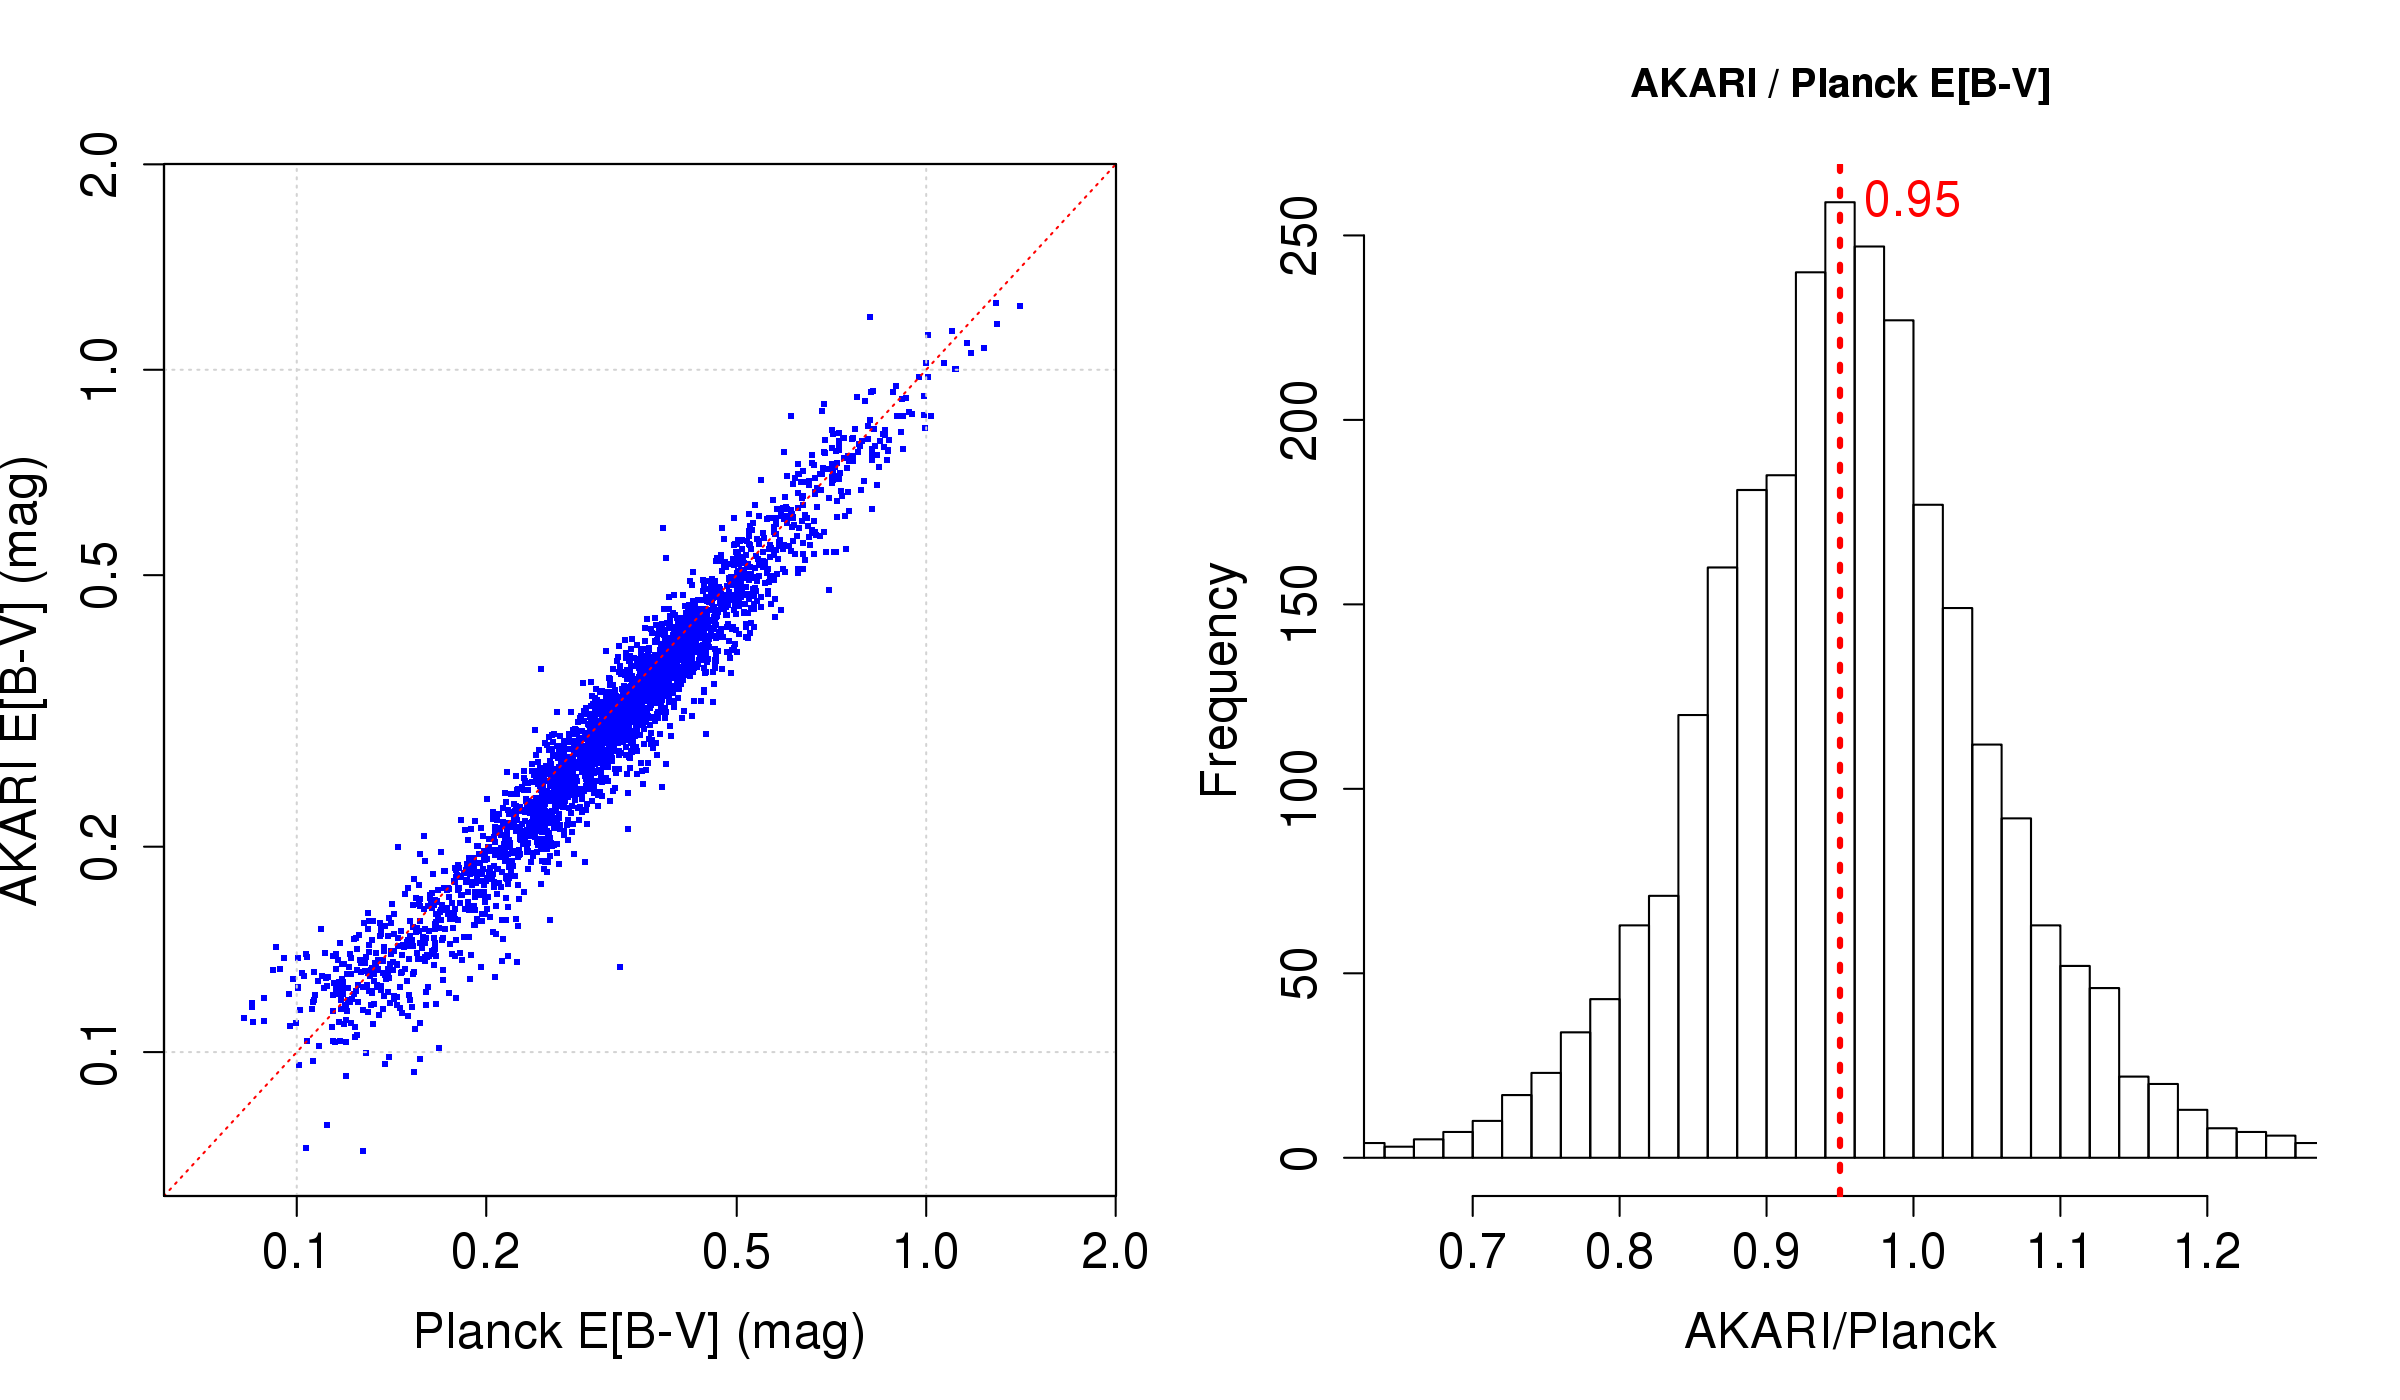
AKARI vs. Planck E[B-V]
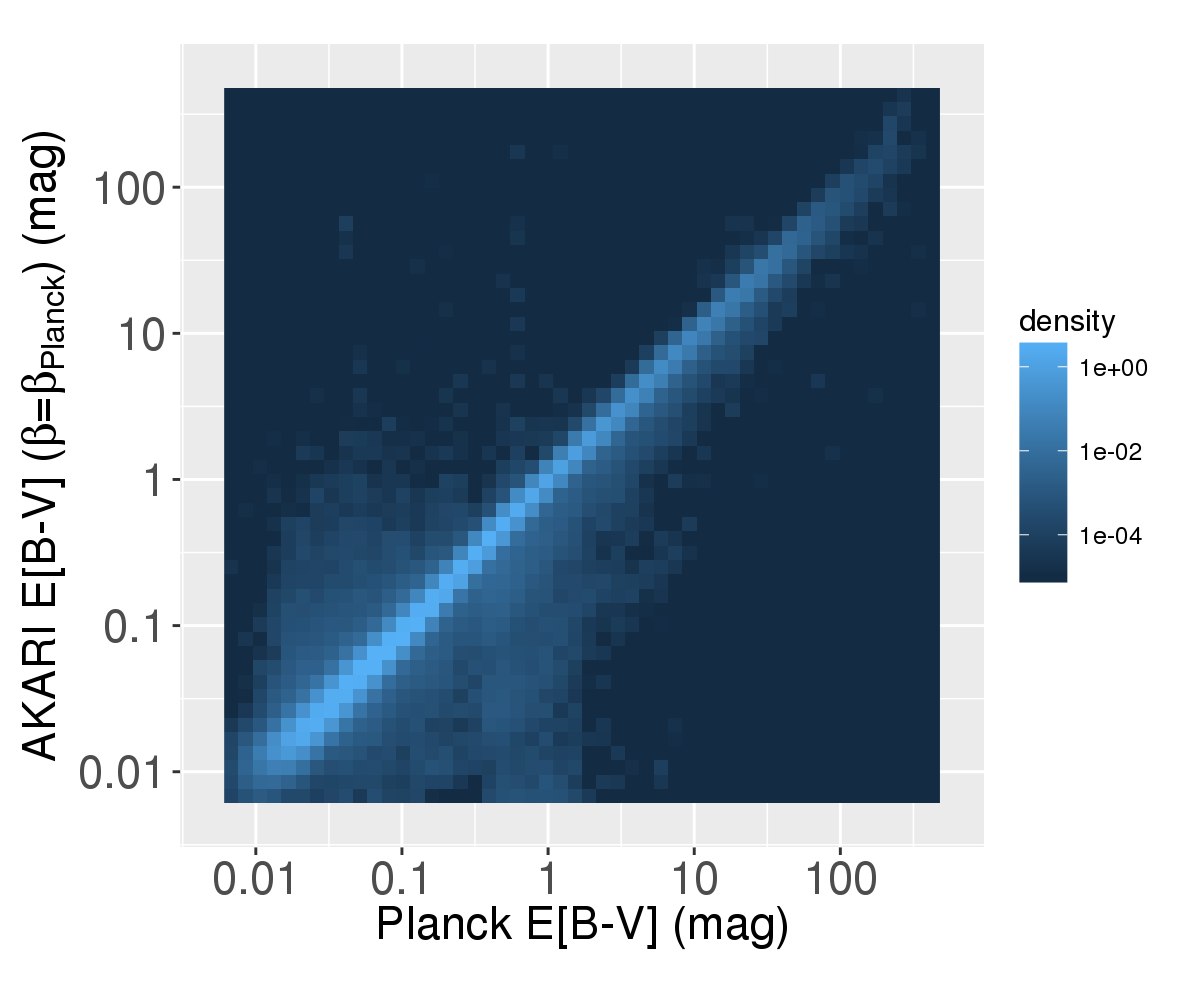
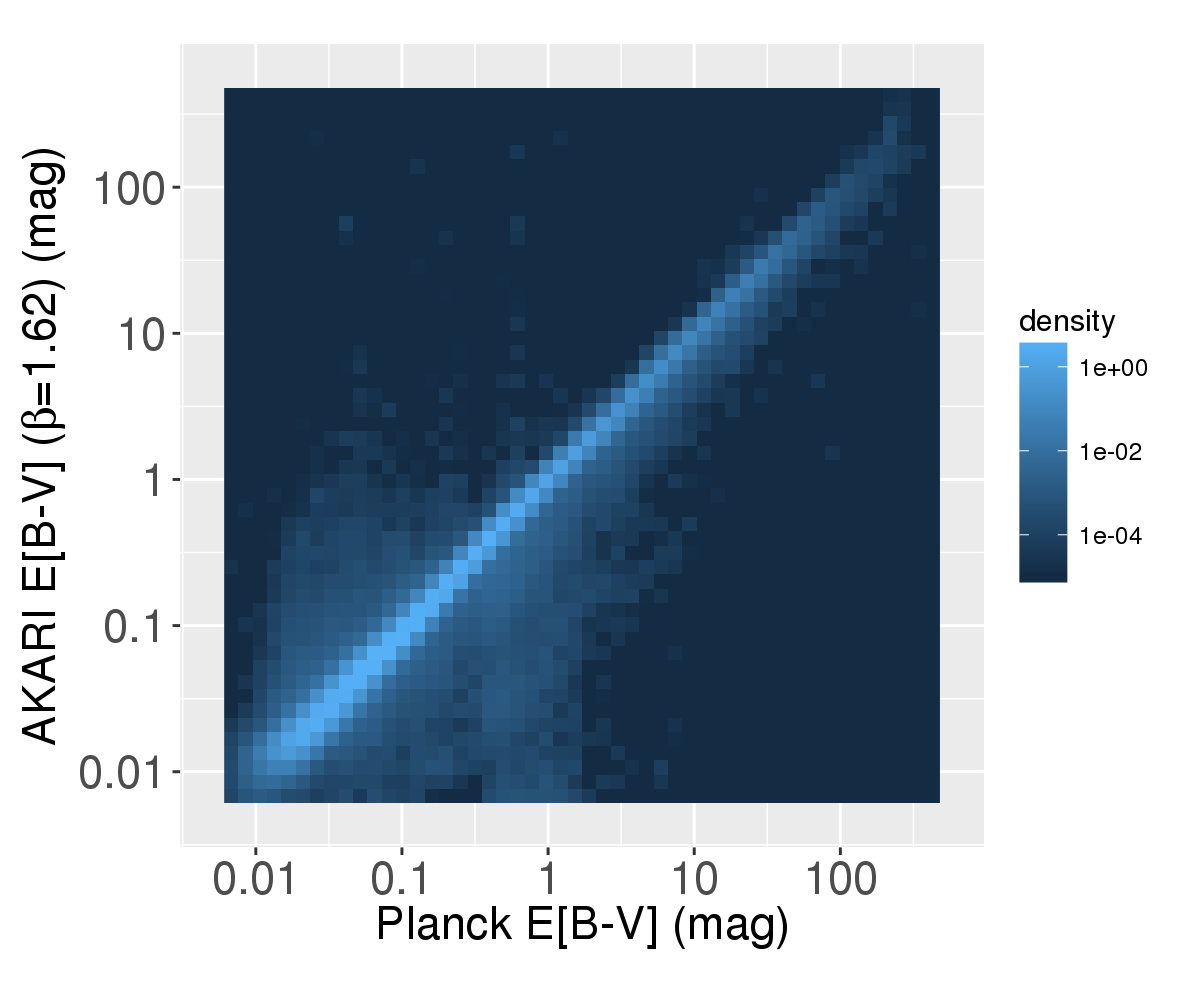
AKARI vs. Planck E[B-V]
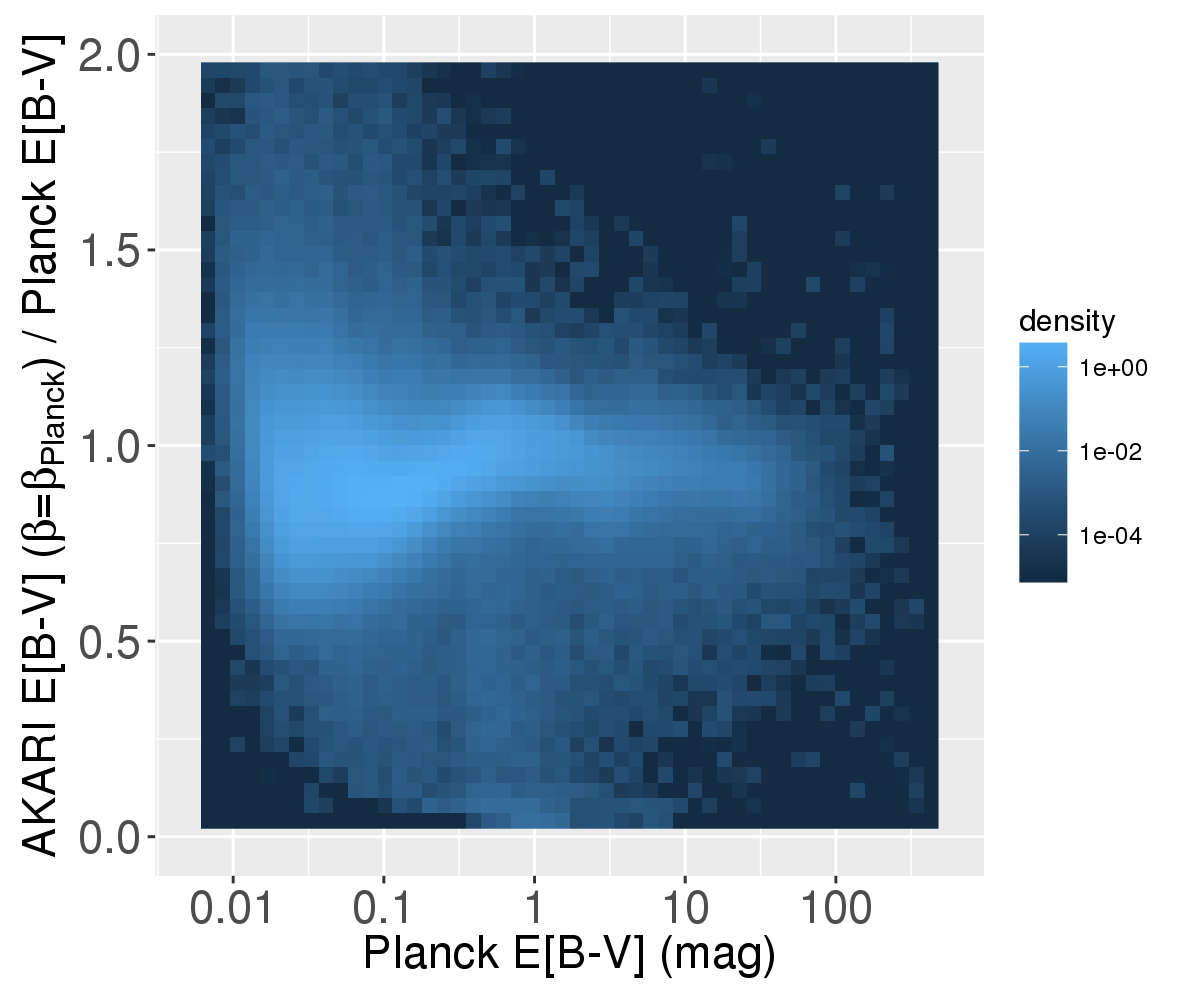
AKARI vs. Planck E[B-V] ratio
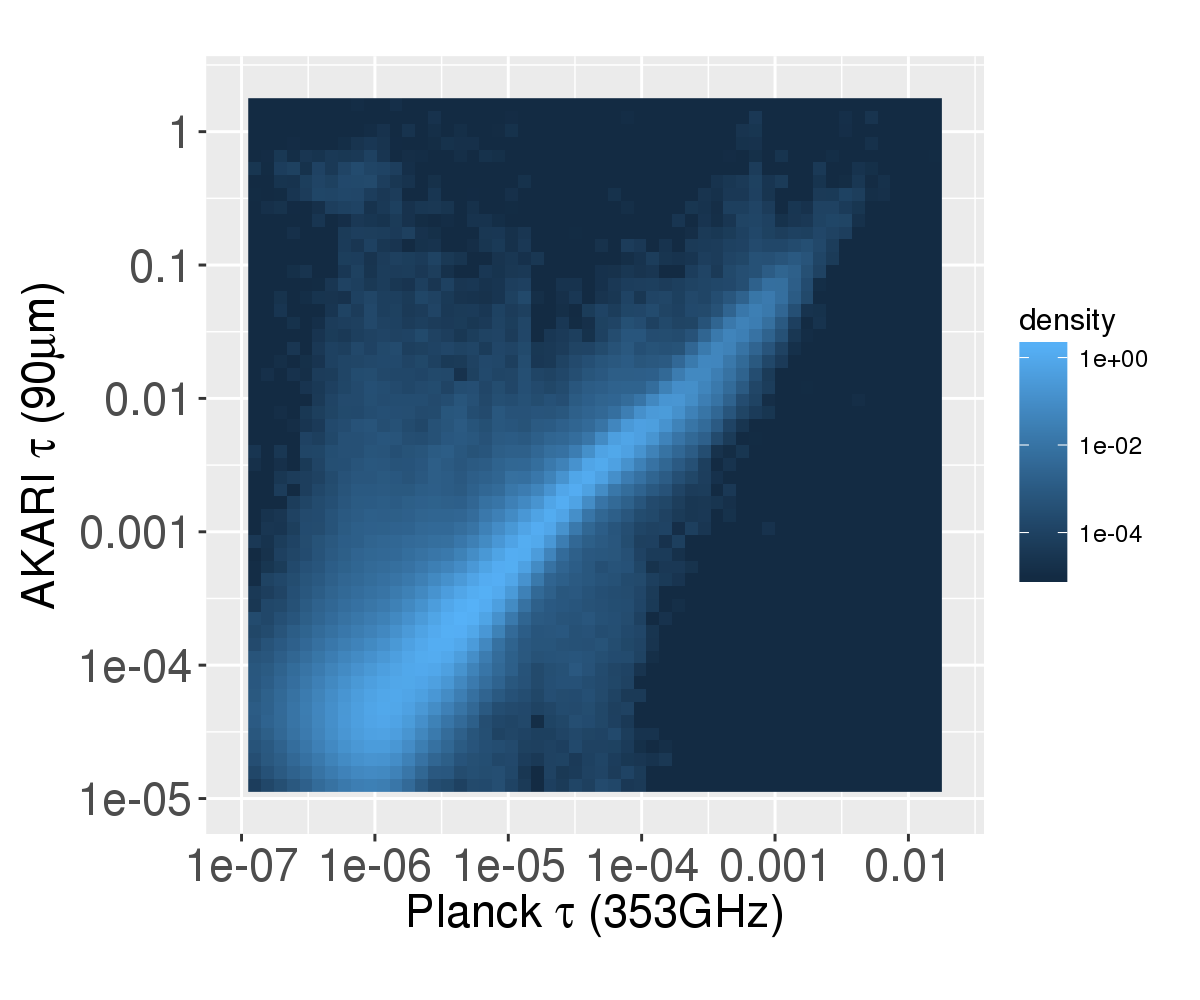
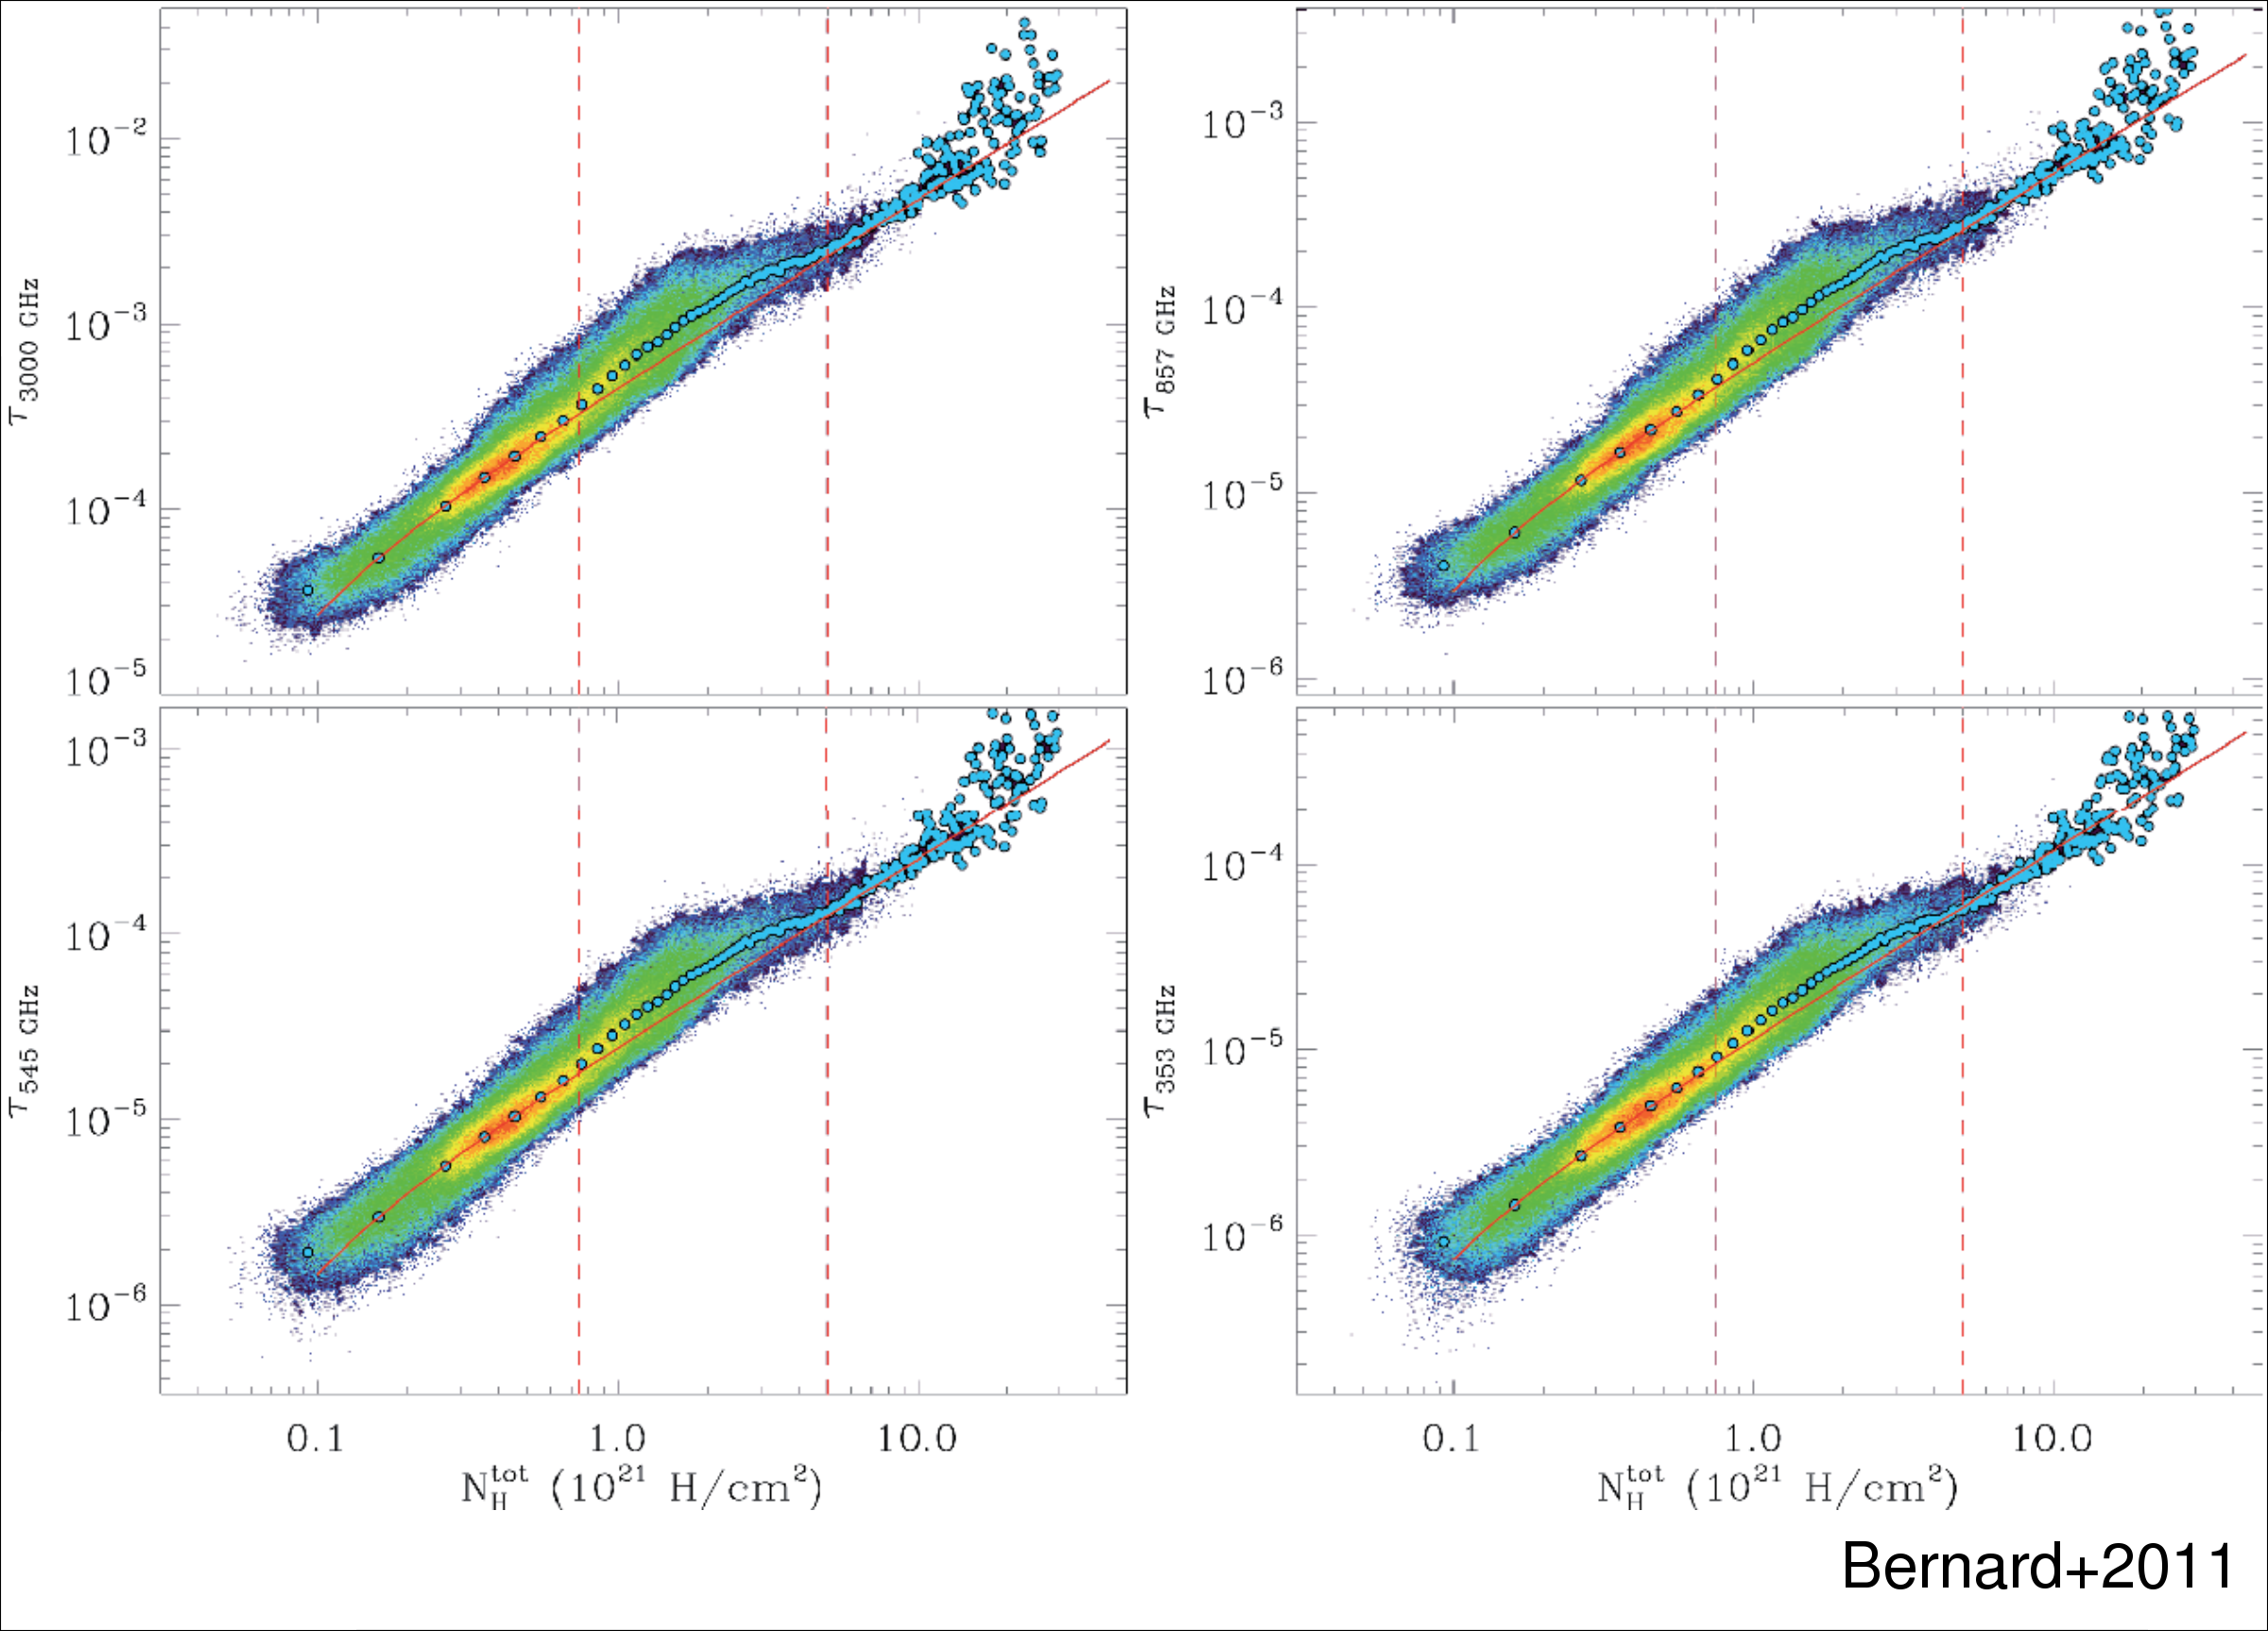
AKARI vs. Planck \(\tau\)
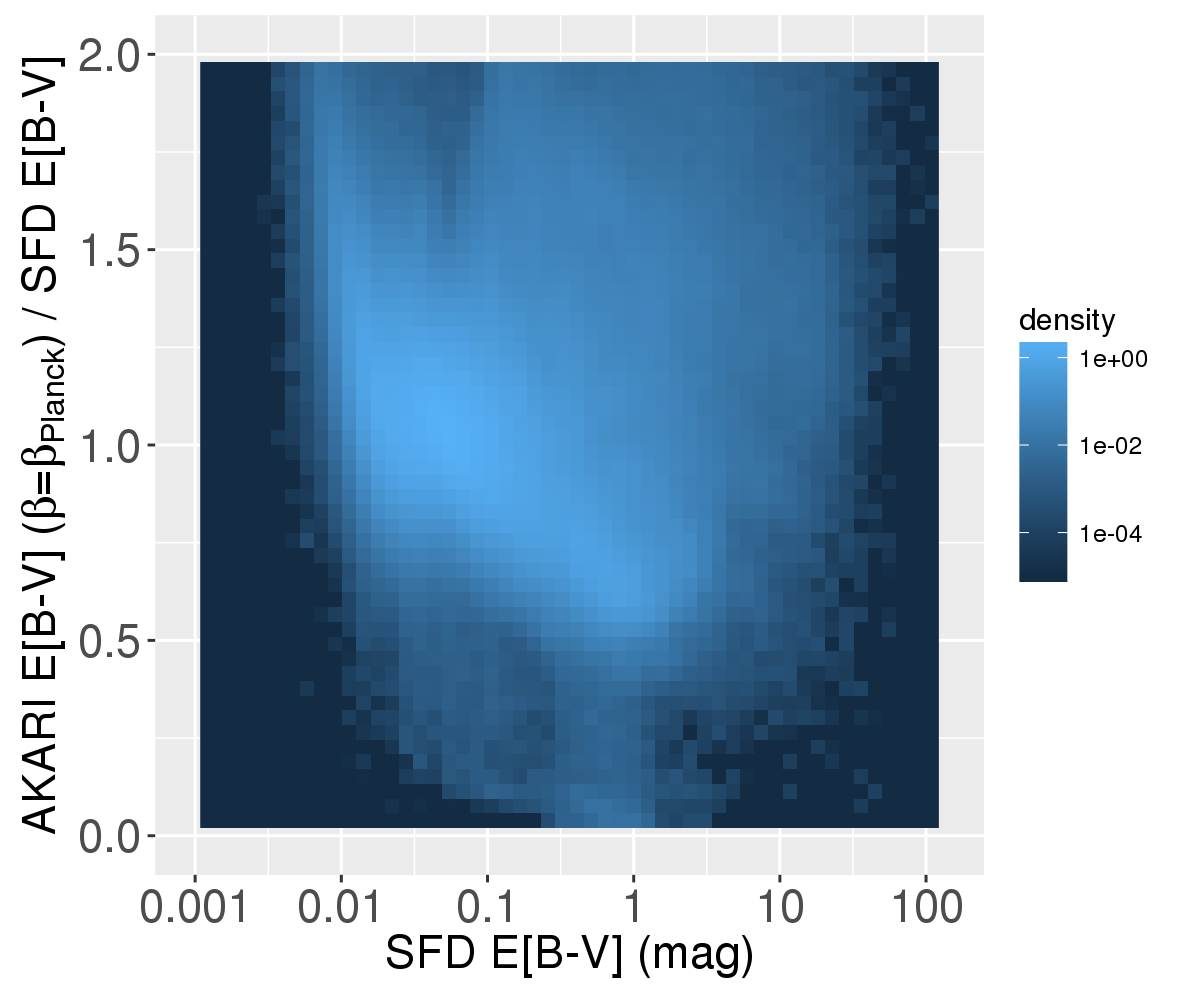
AKARI vs. SFD E[B-V] ratio
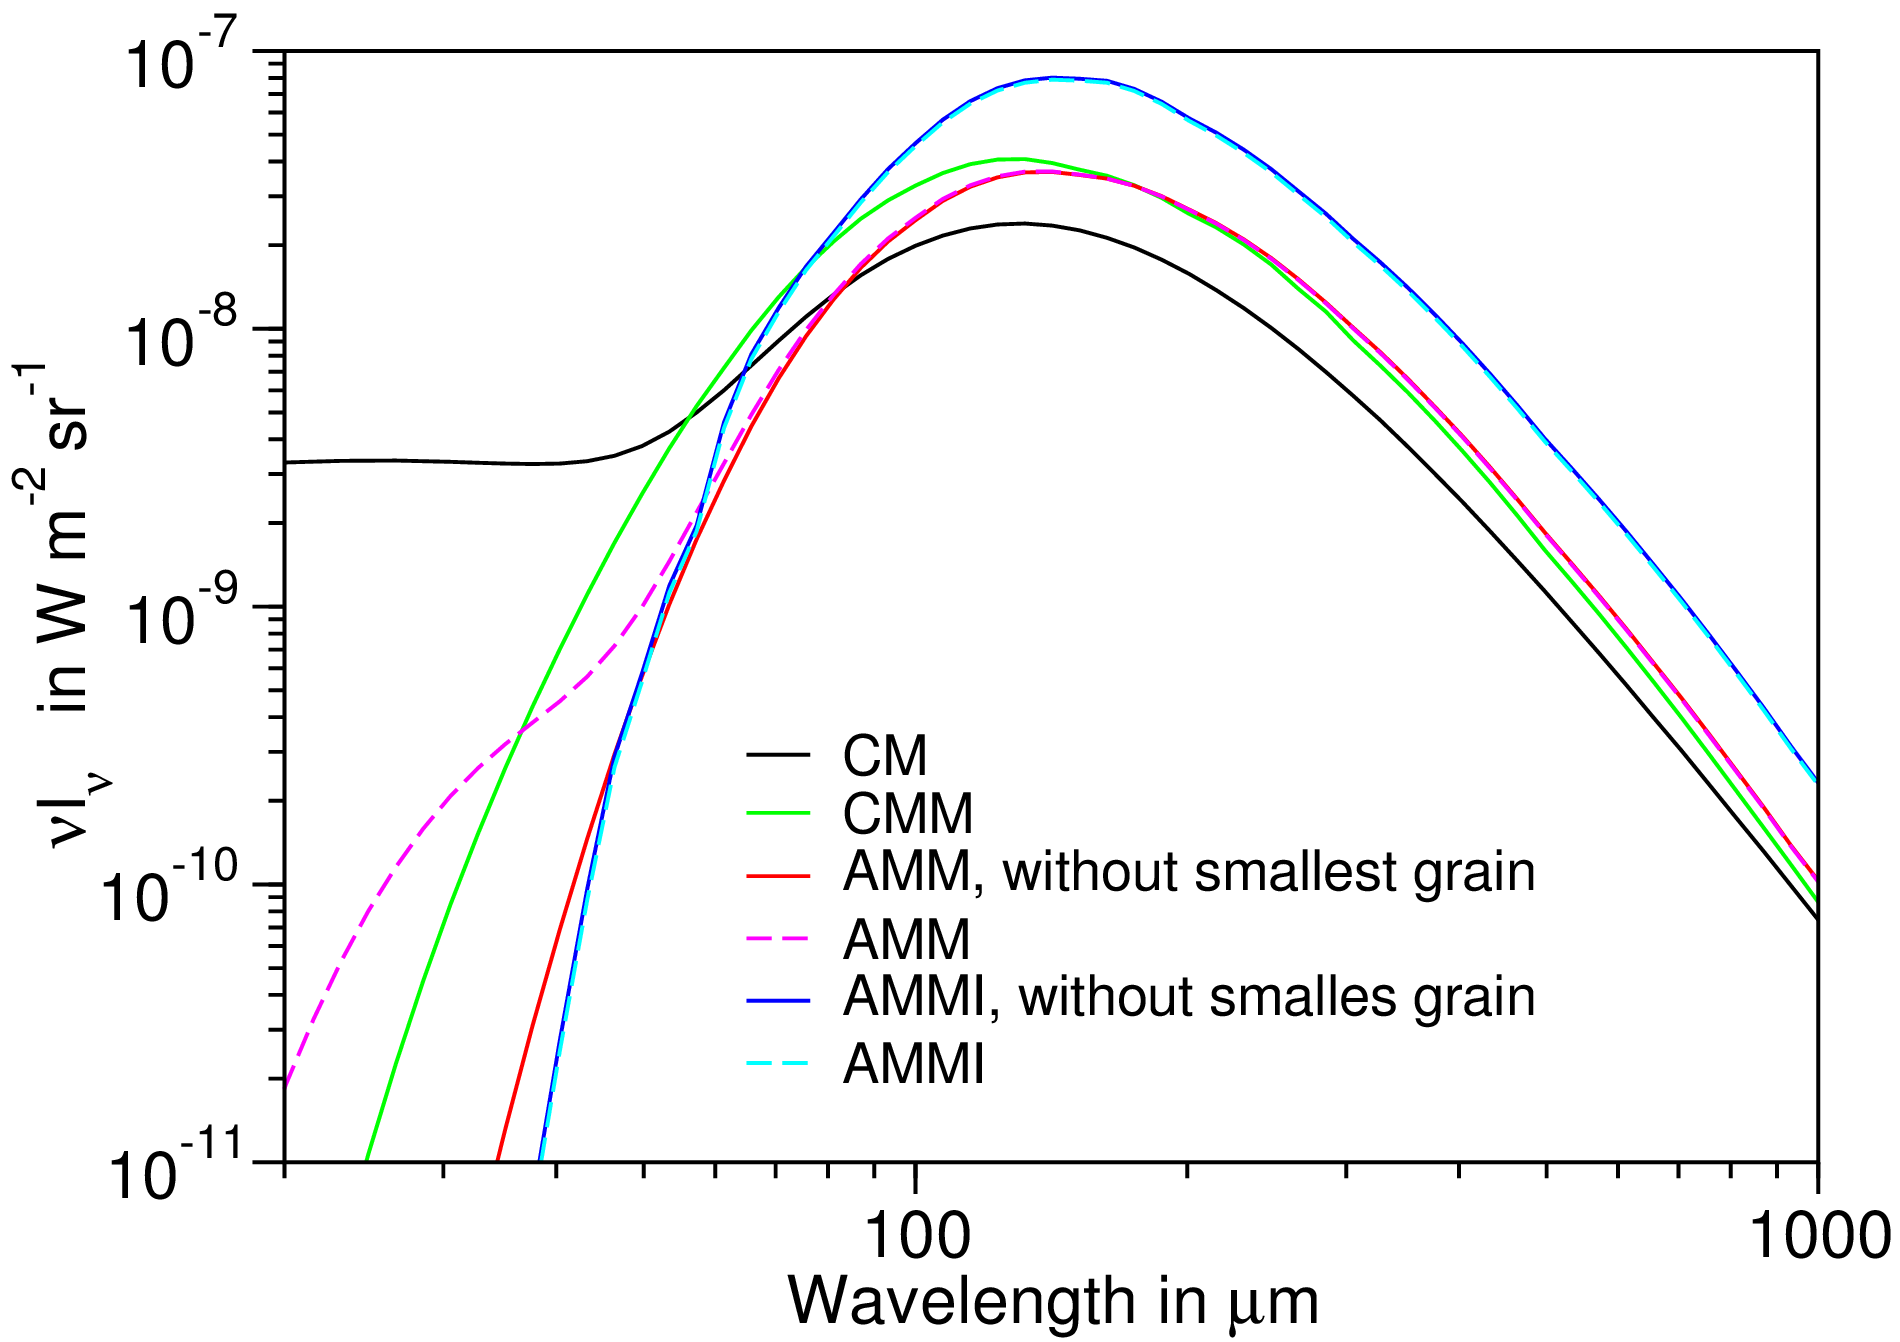
DustEM model fitting
- fit by dust spectra in diffuse ISM
- 2 parameters: heating (temperature) & dust column
- fixed dust size distribution

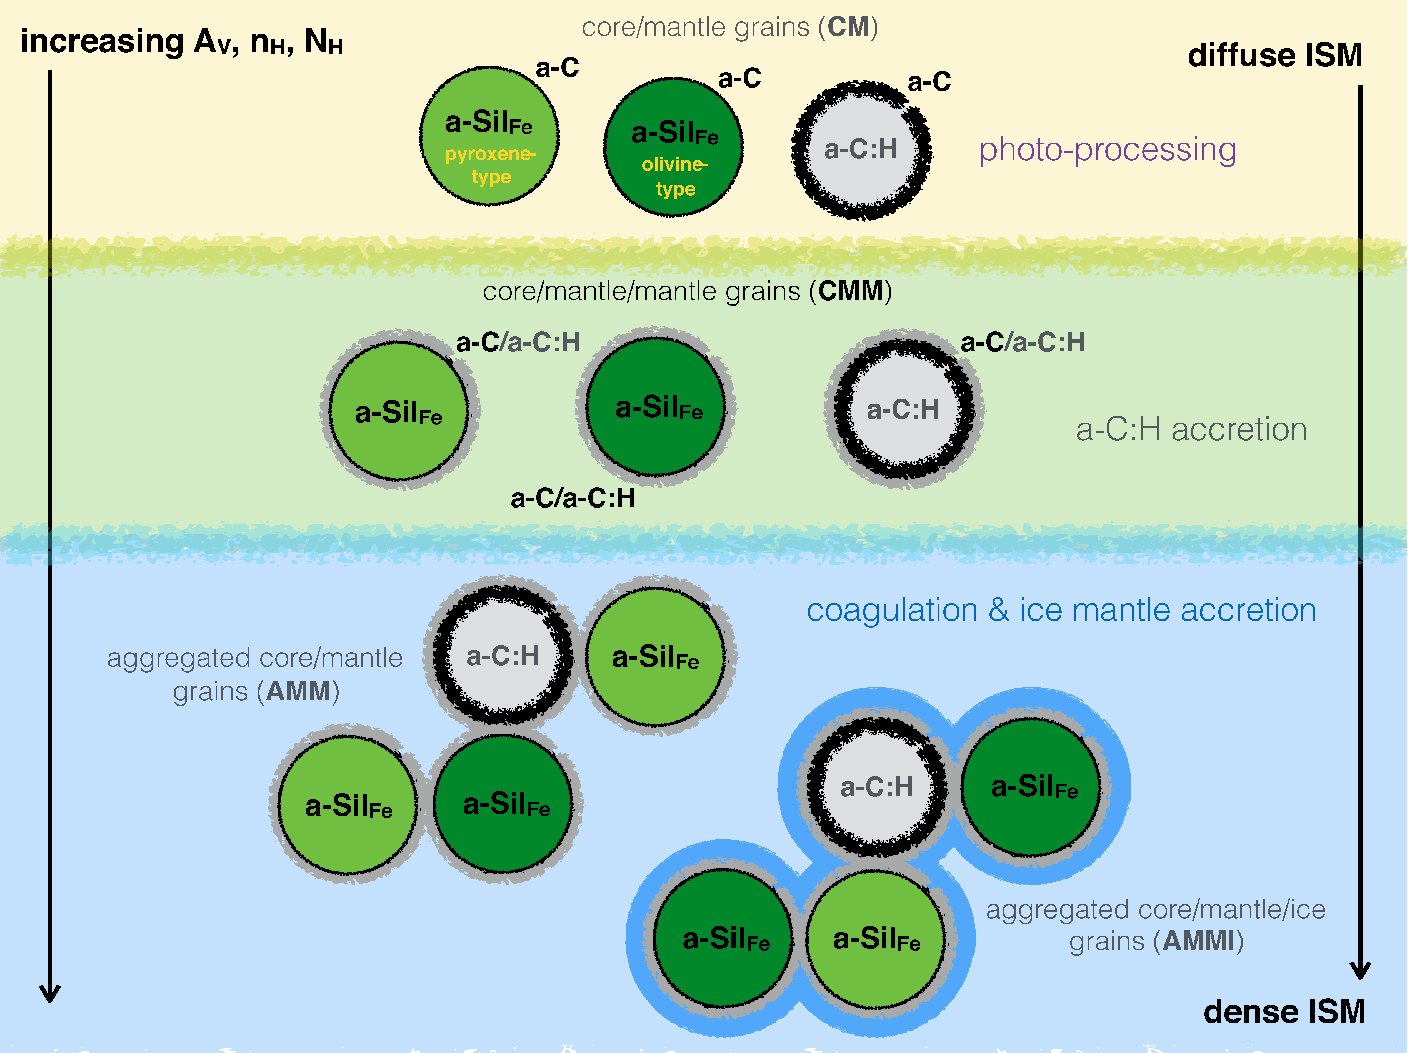
Dust "evolution"
from diffuse to dense ISM
Dust SED in low \(G_0\) (dense) regions
- Deficiency of small grains
- Dust size growth/aggregation in dense regions
- Lack of dust destruction under low \(G_0\) condition
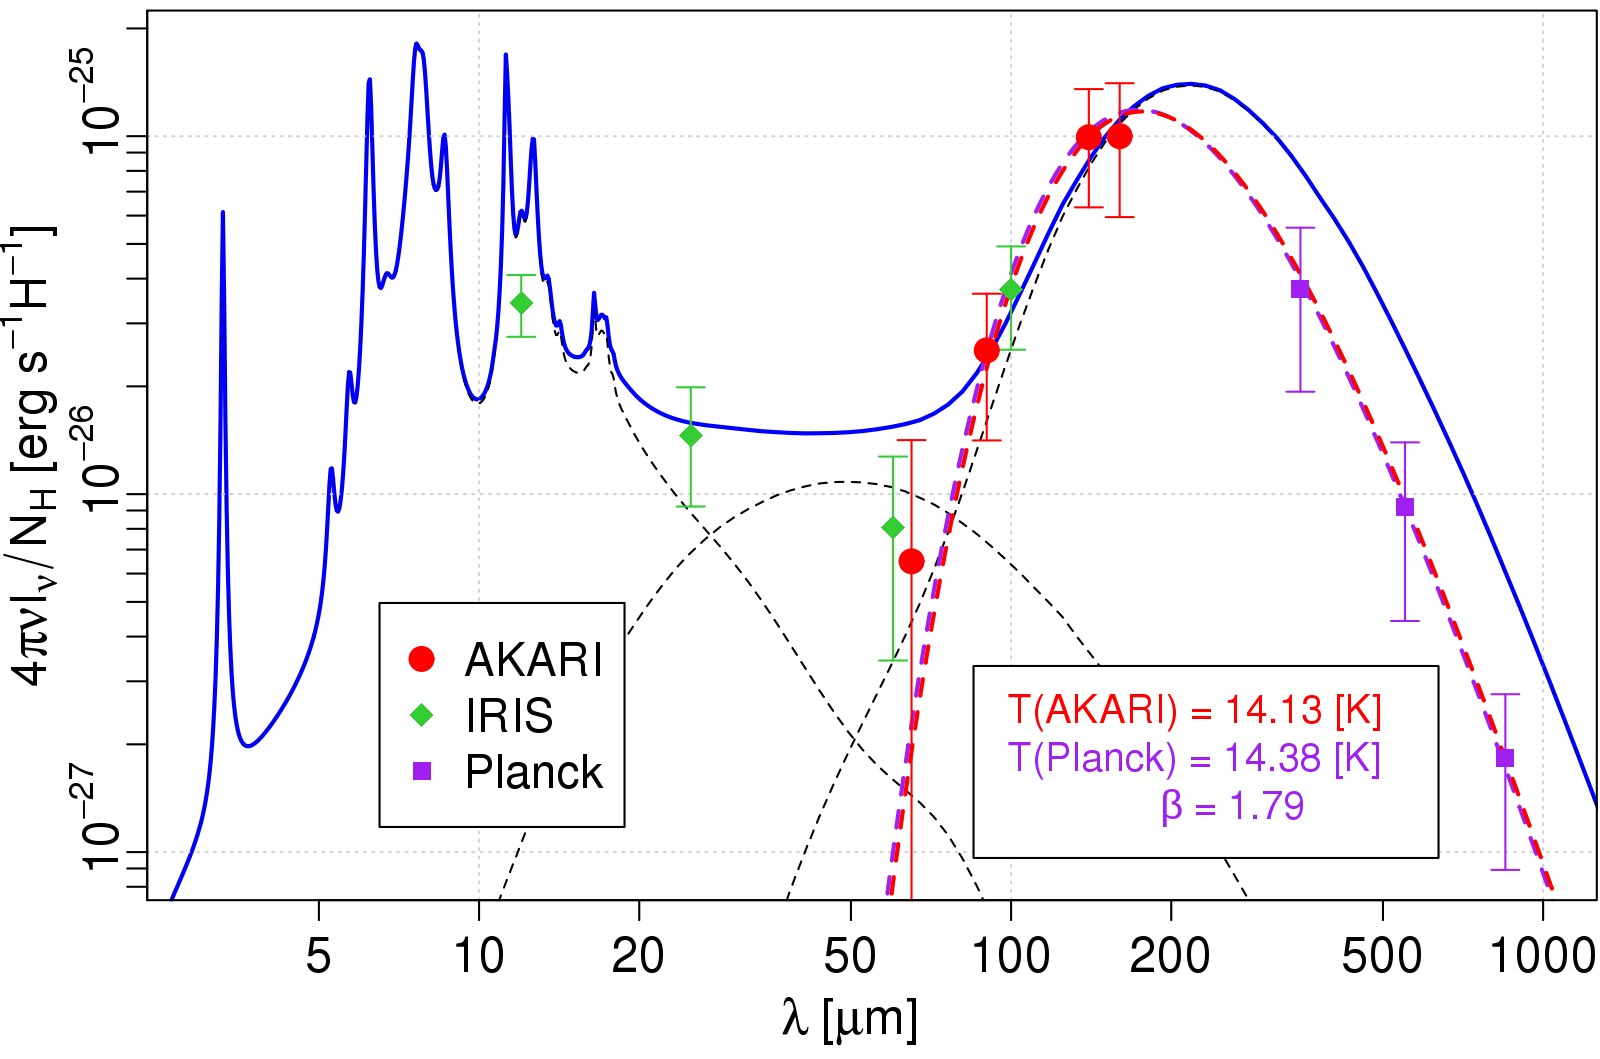
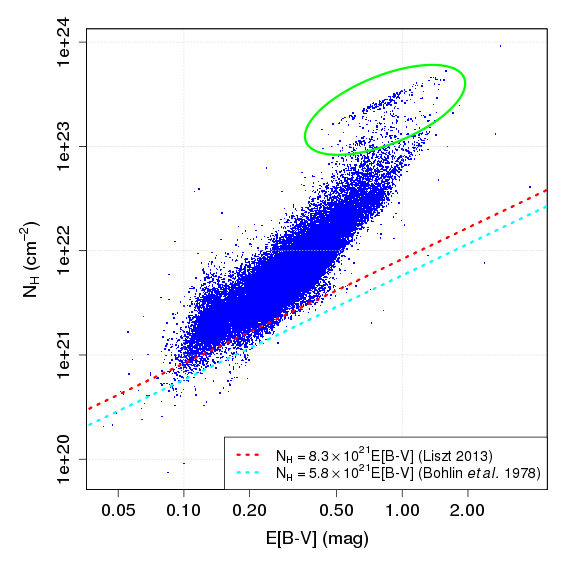
Regions where DustEM model fit fails
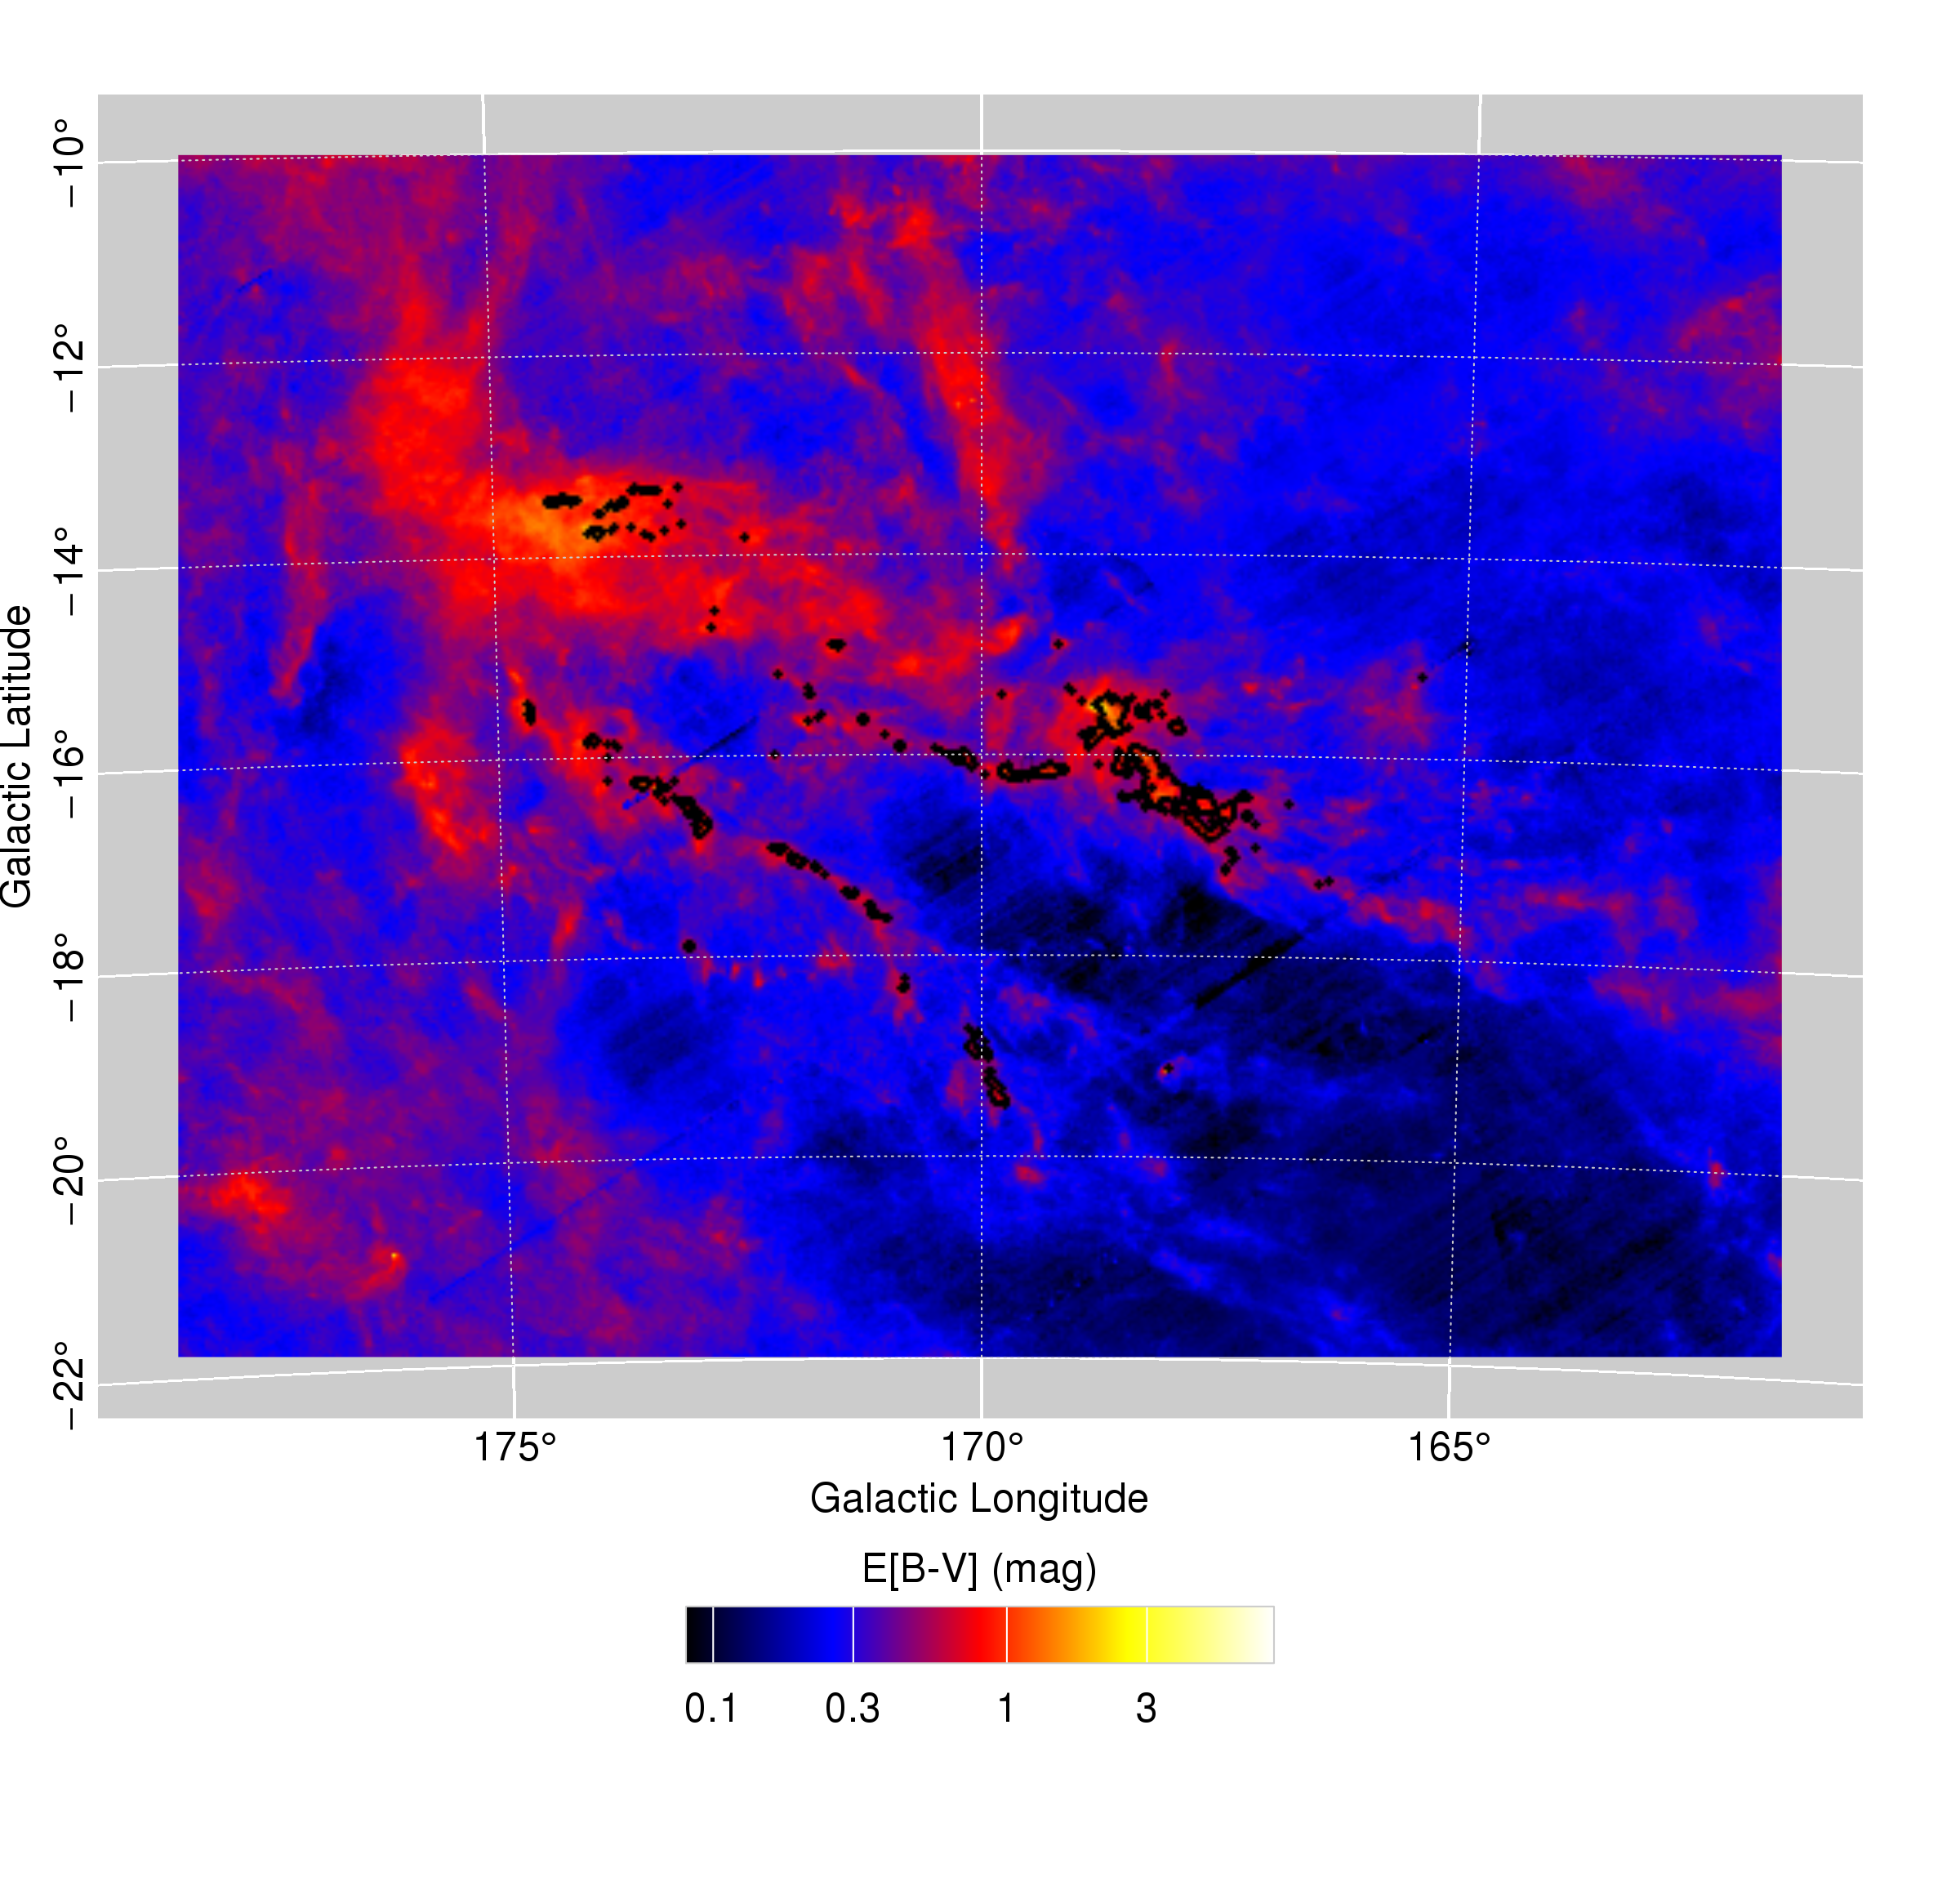
Taurus region DustEM fit vs. E[B-V]
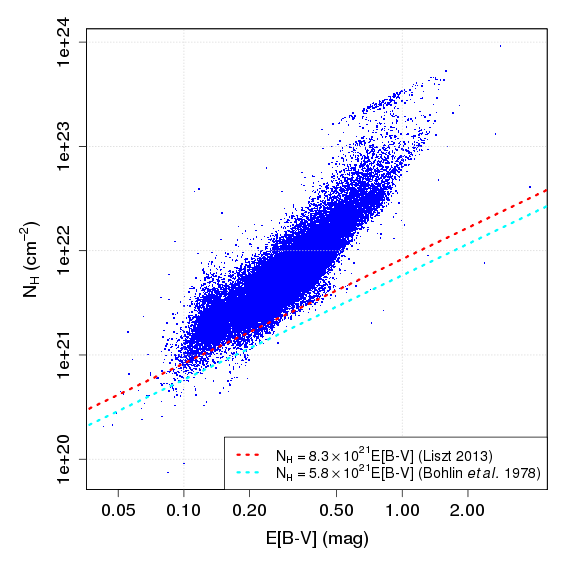
Taurus region DustEM fit vs. E[B-V]
Taurus region G\(_0\) vs. E[B-V]
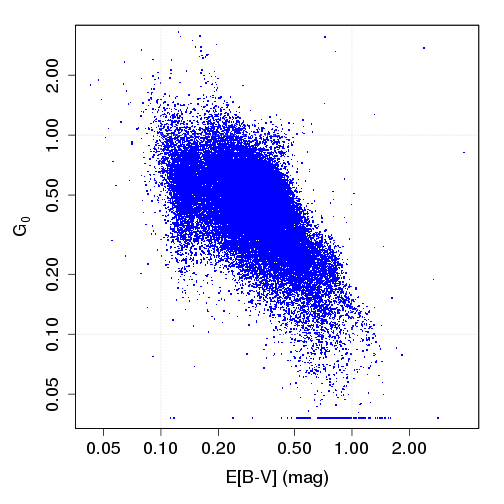
Taurus region G\(_0\) vs. E[B-V]
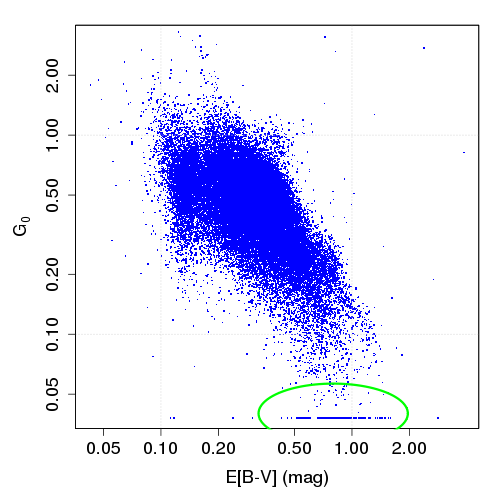
Dust SED in low \(G_0\) (dense) regions
- Deficiency of small grains
- Dust size growth/aggregation in dense regions
- Lack of dust destruction under low \(G_0\) condition

Dust SED in low \(G_0\) (dense) regions
- Deficiency of small grains
- Dust size growth/aggregation in dense regions
- Lack of dust destruction under low \(G_0\) condition
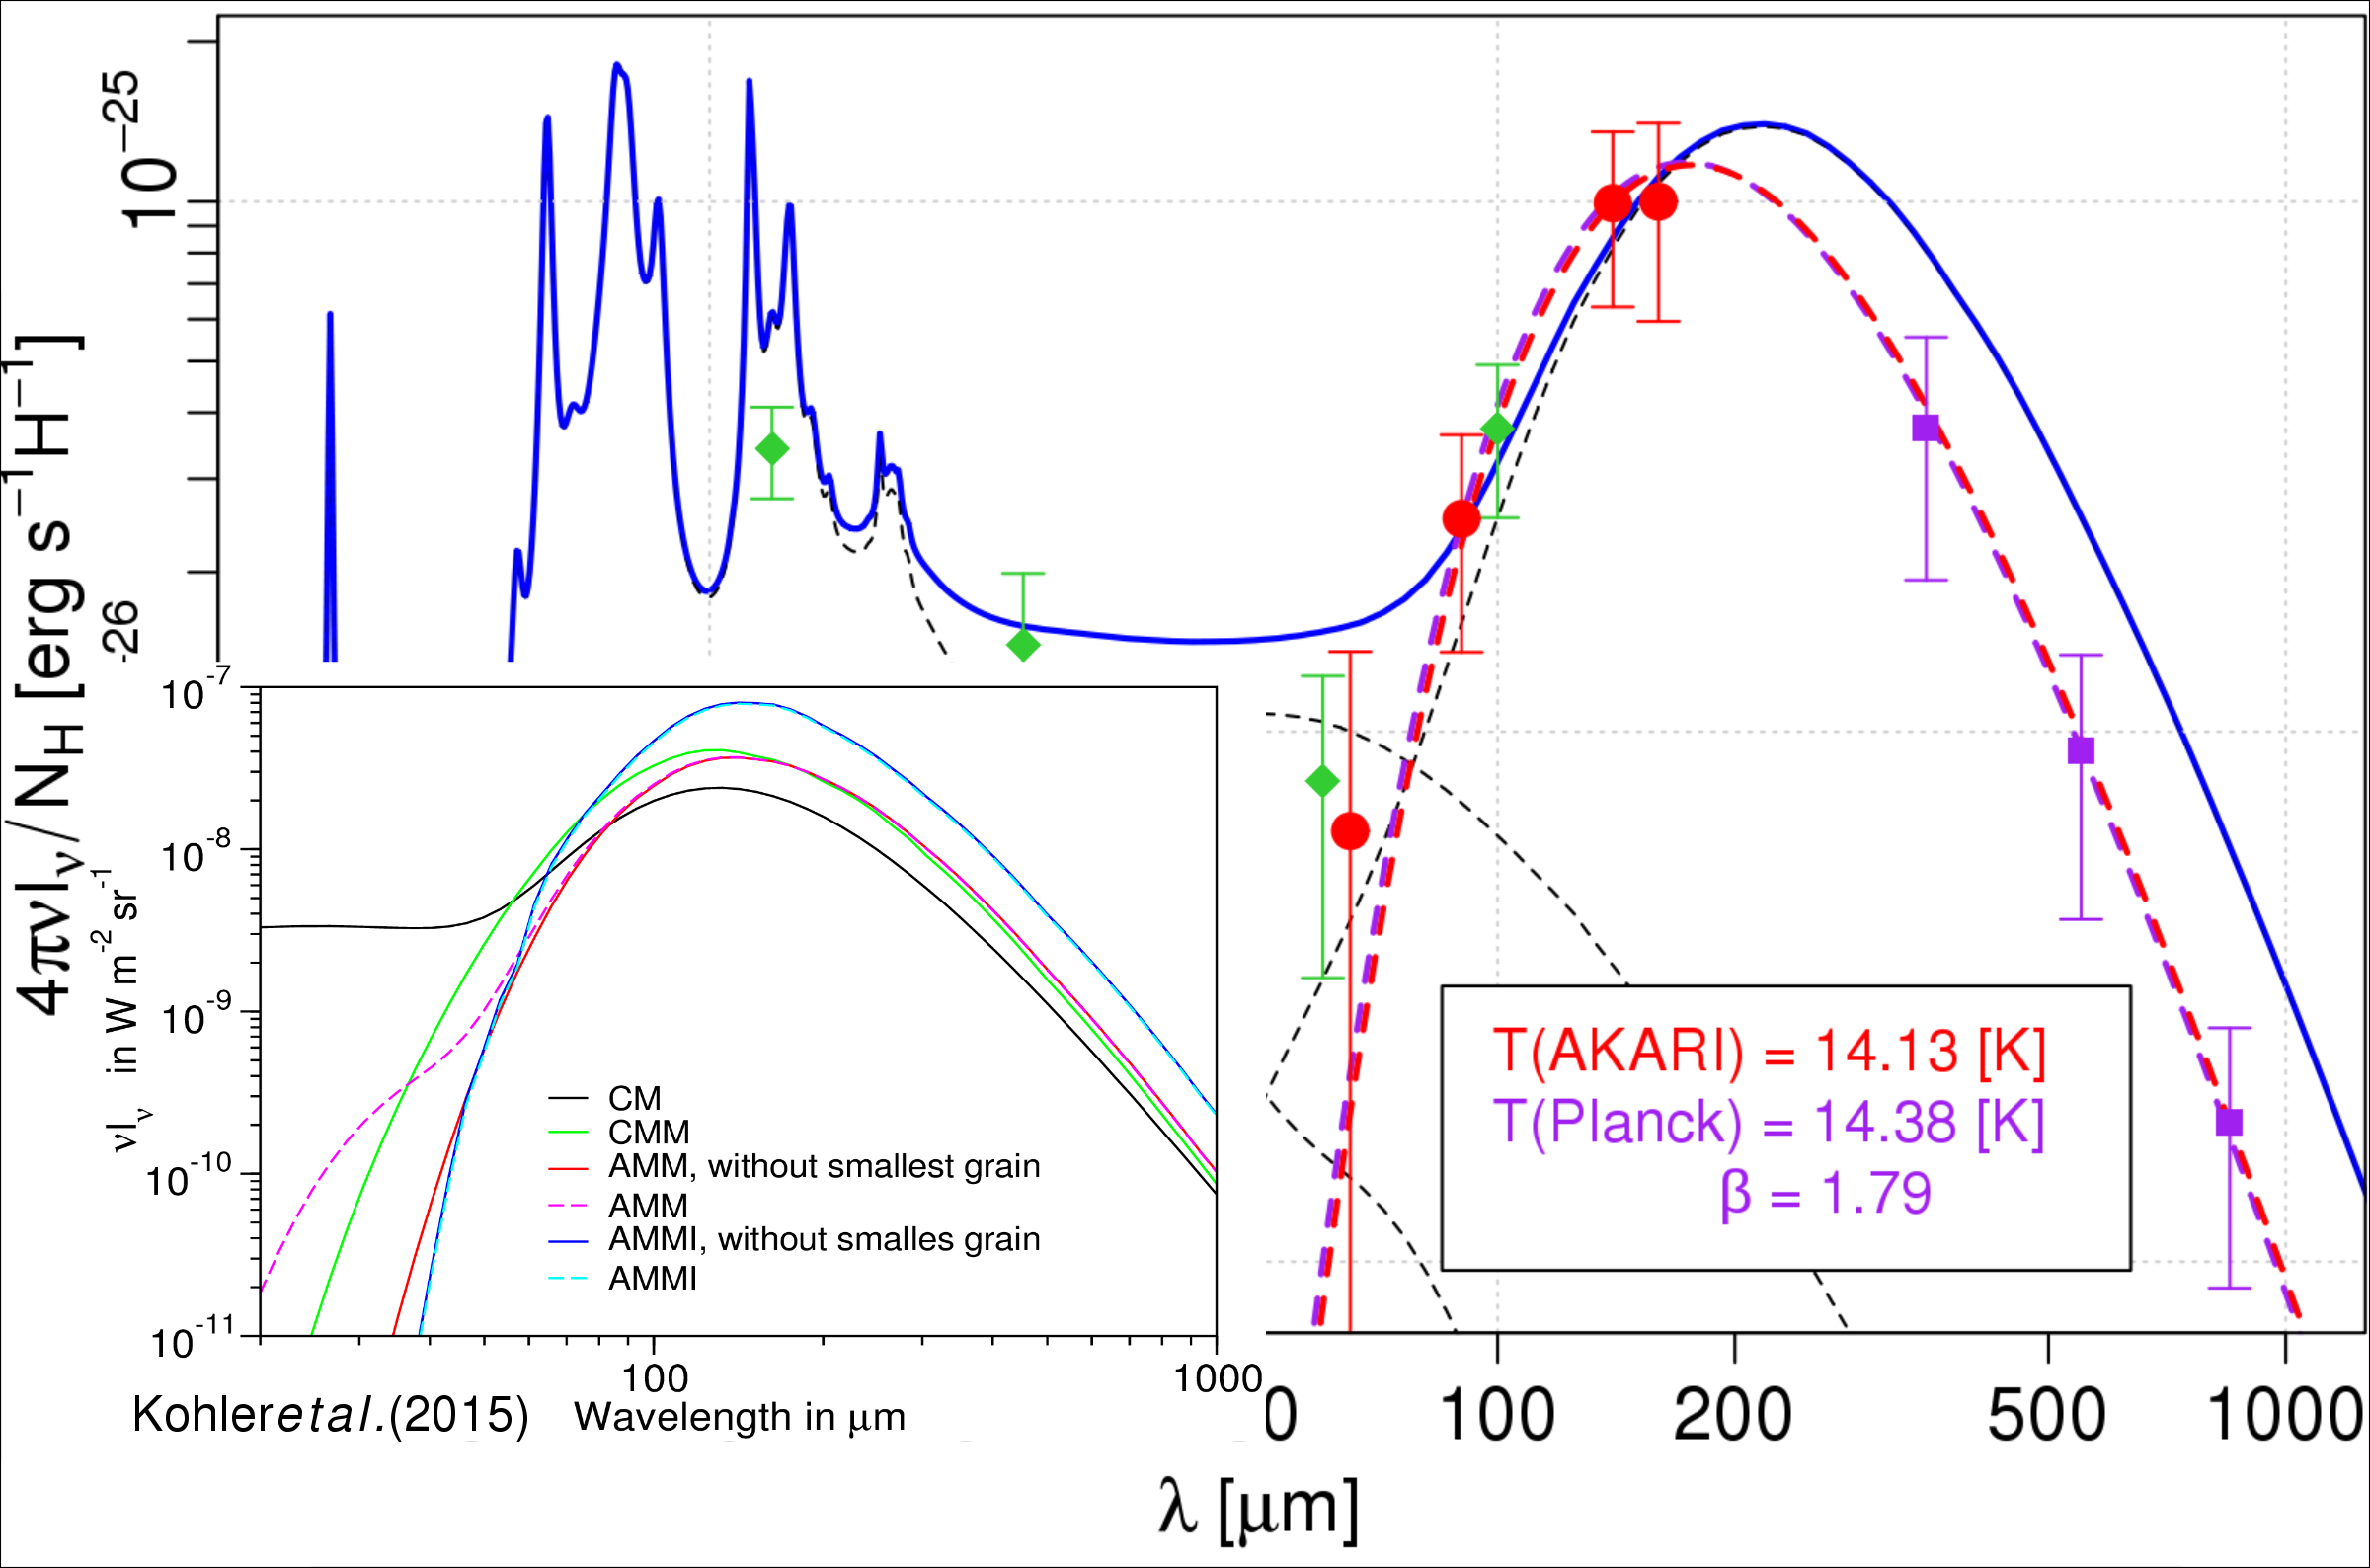
AKARI vs. Planck E[B-V] @ Taurus
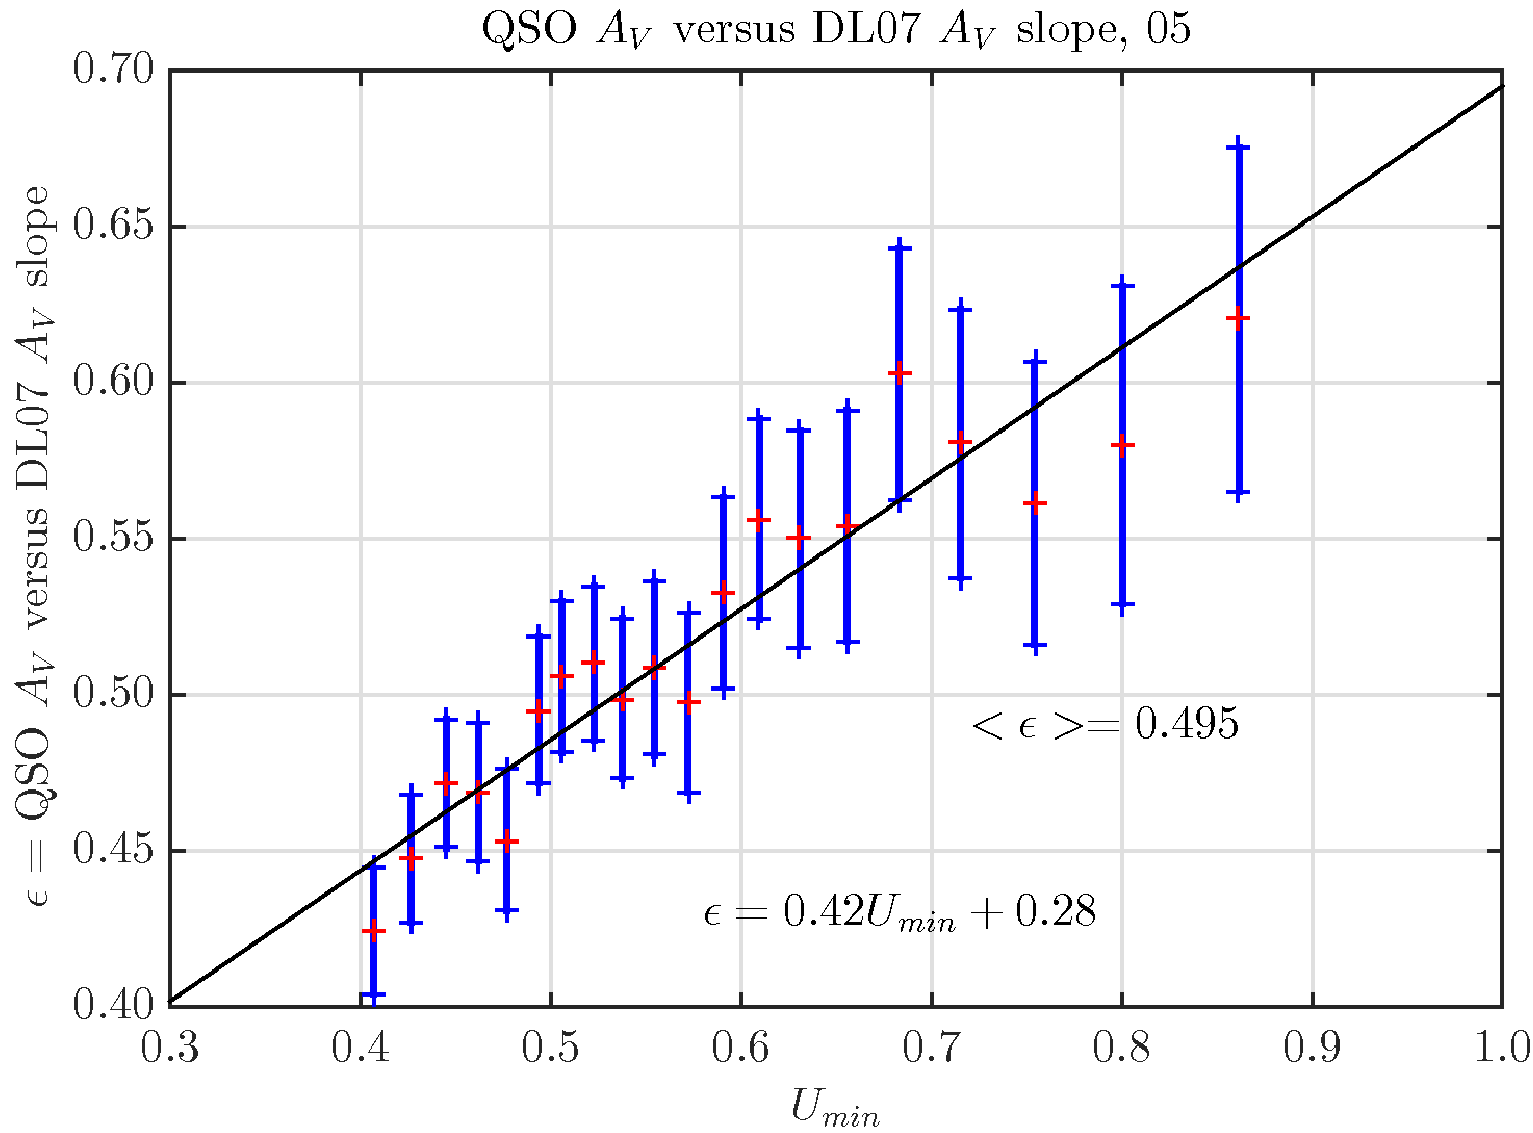
Aniano et al. (Planck collab. 2016)
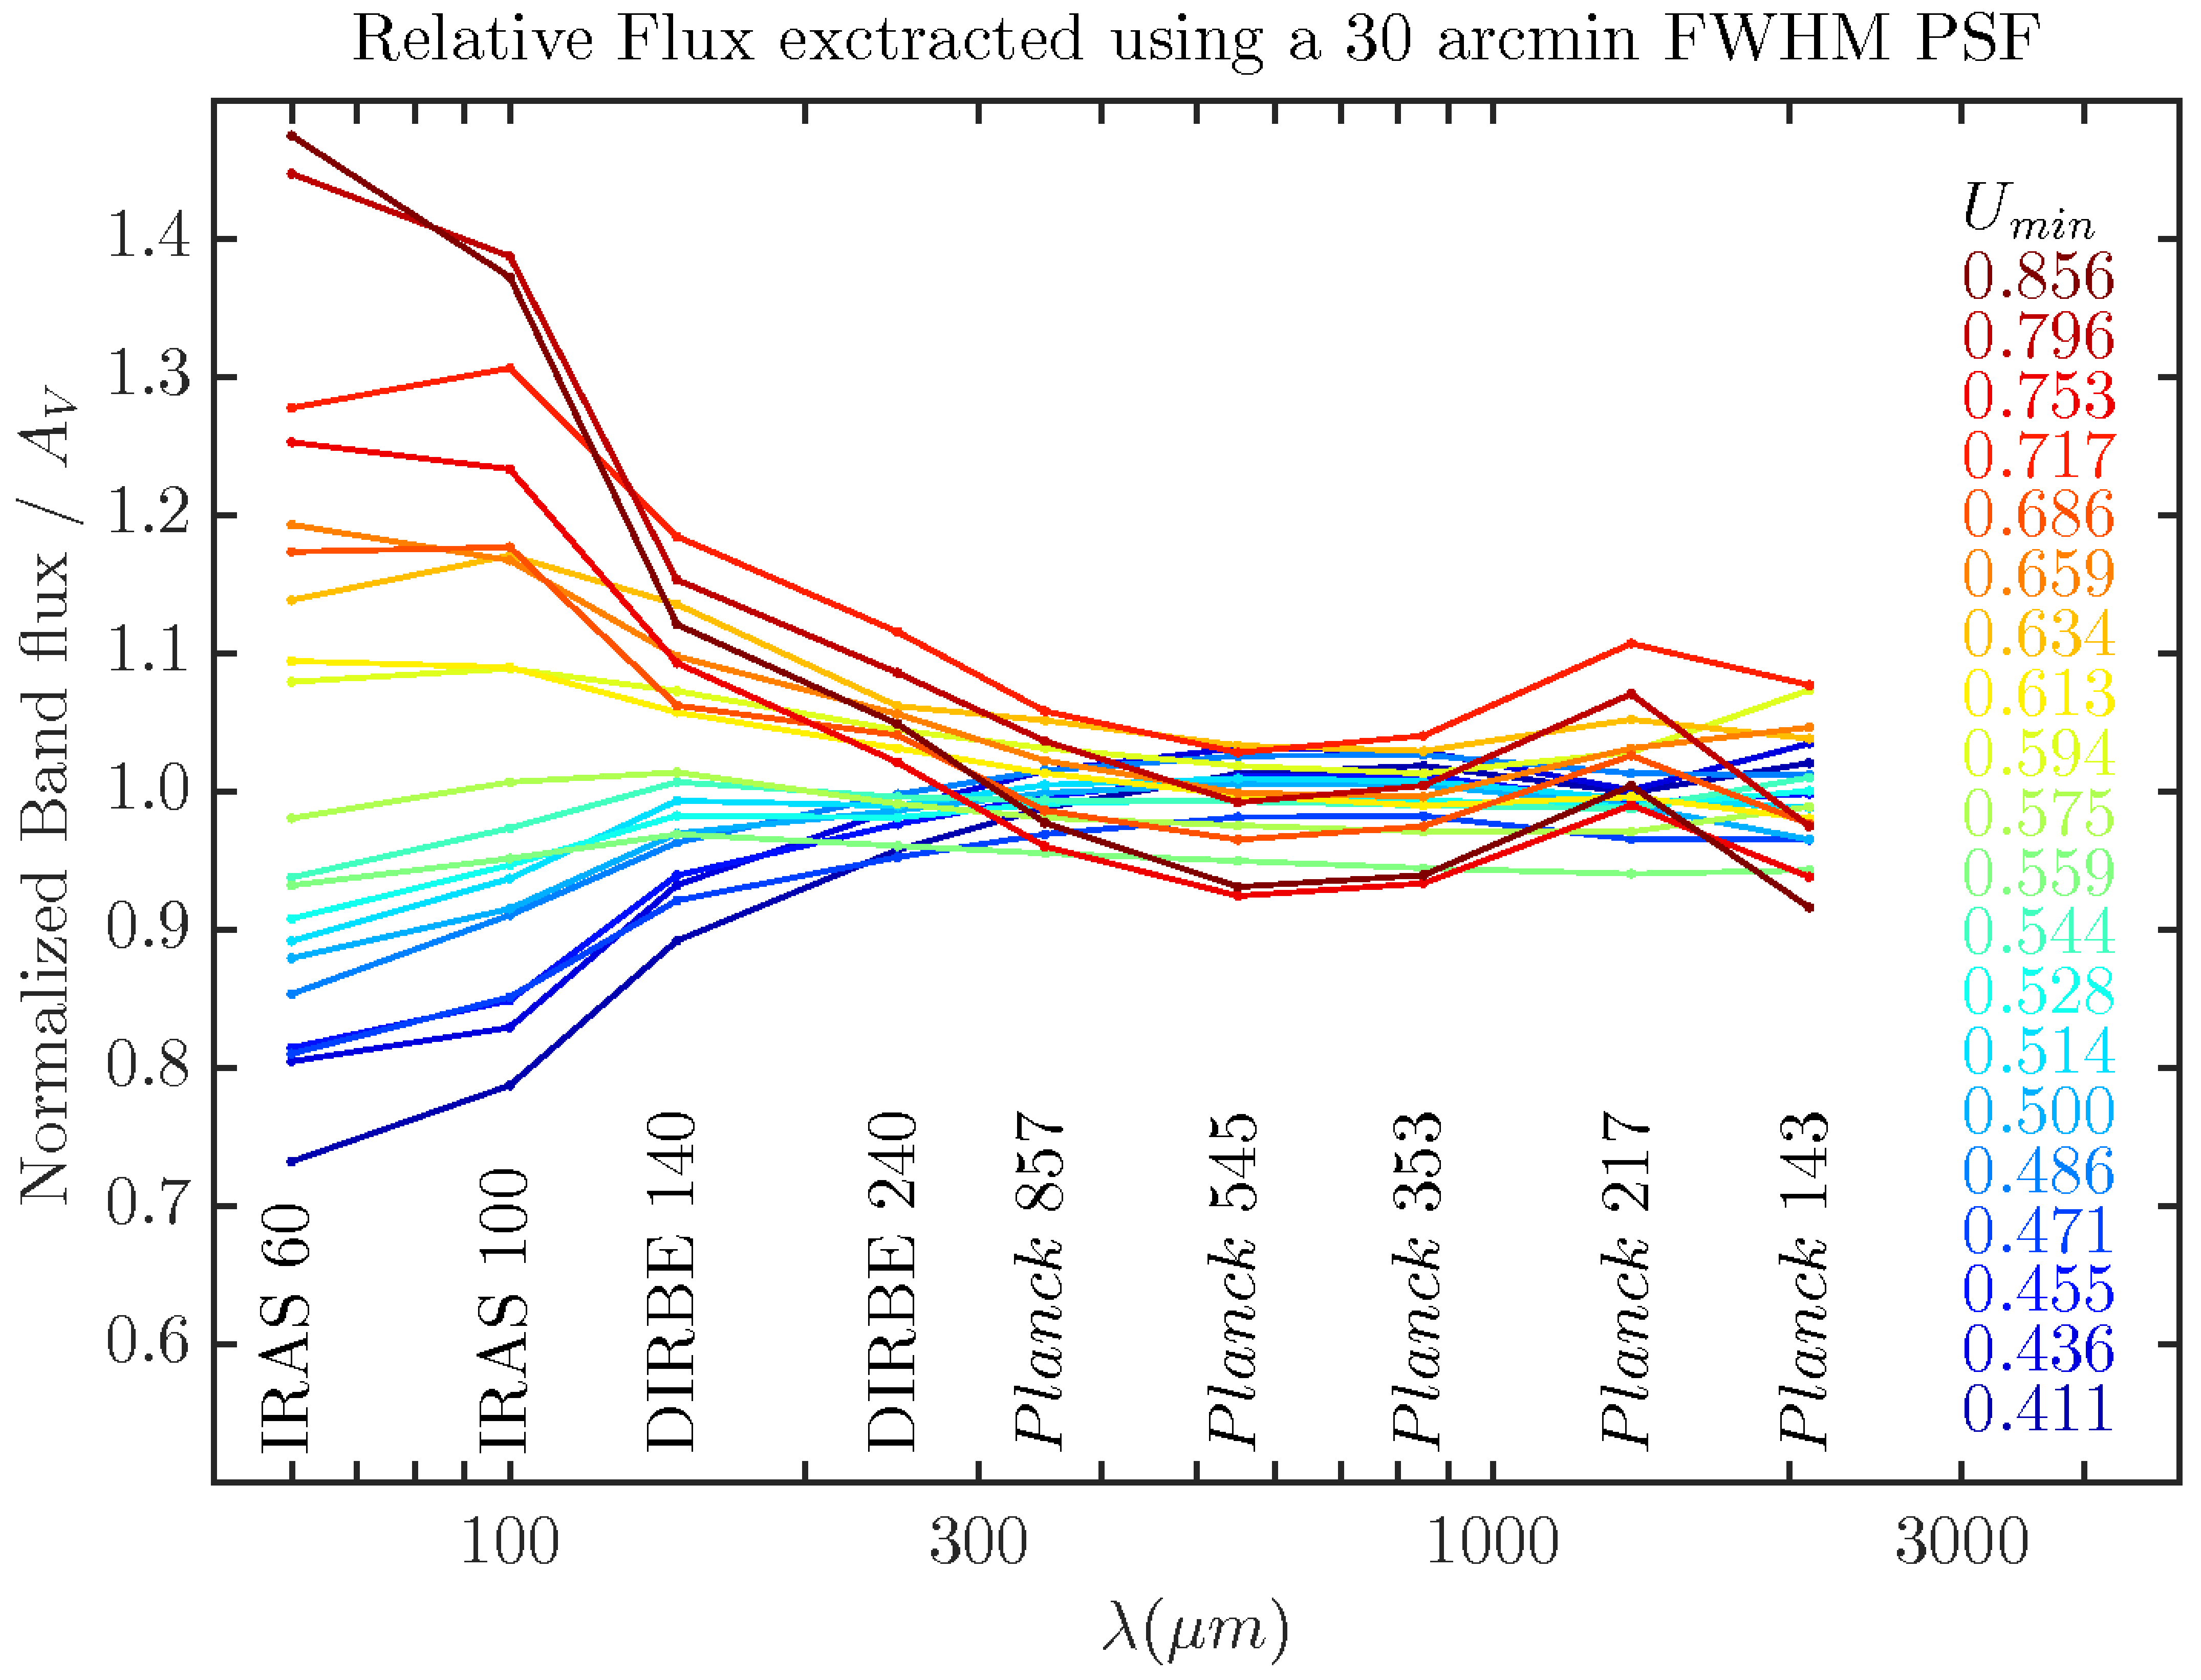
Flagey et al. (2009)
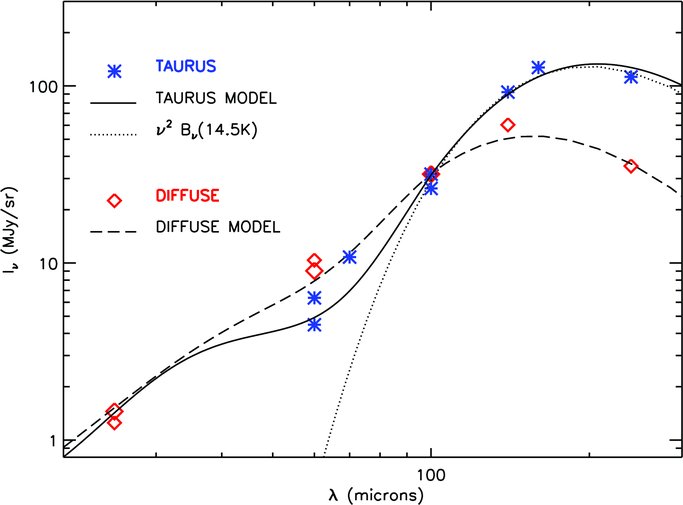
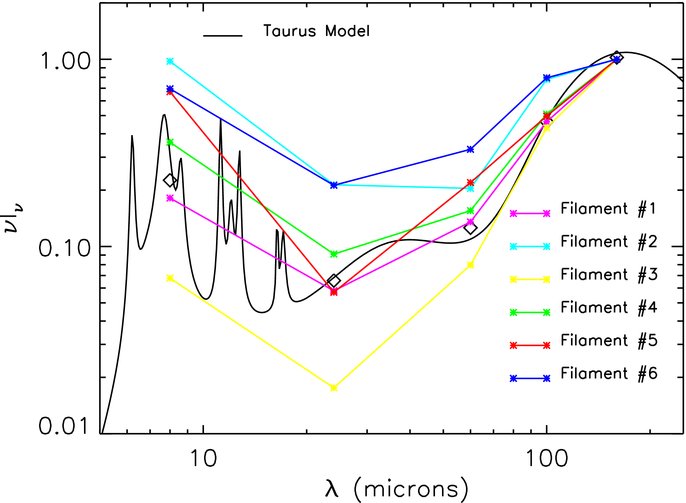
Omnipresence of ISM filaments
One of the key findings of Herschel
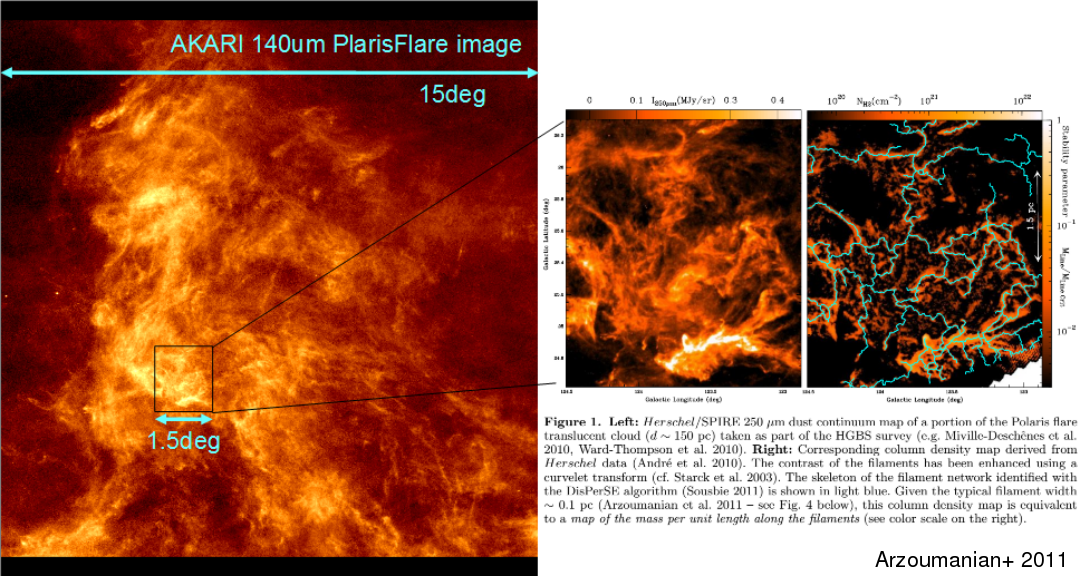
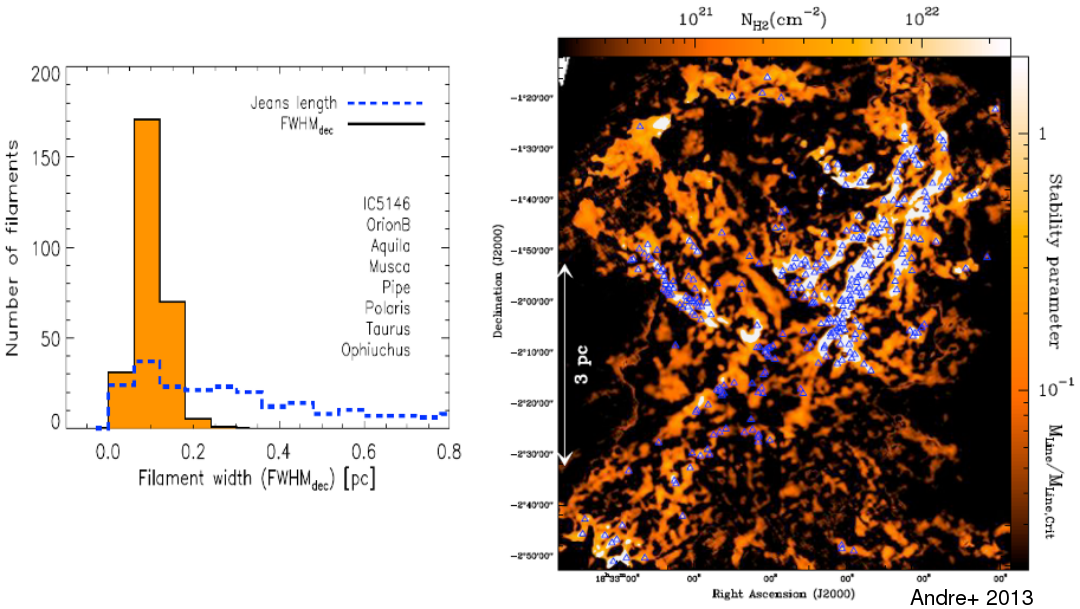
Filaments and star formation activities
"universal" \(\sim 0.1\)pc width of the filaments
\(>70\)% prestellar cores found in filaments
Mass Function of Dense Cores
Aquila CMF obs. by Herschel
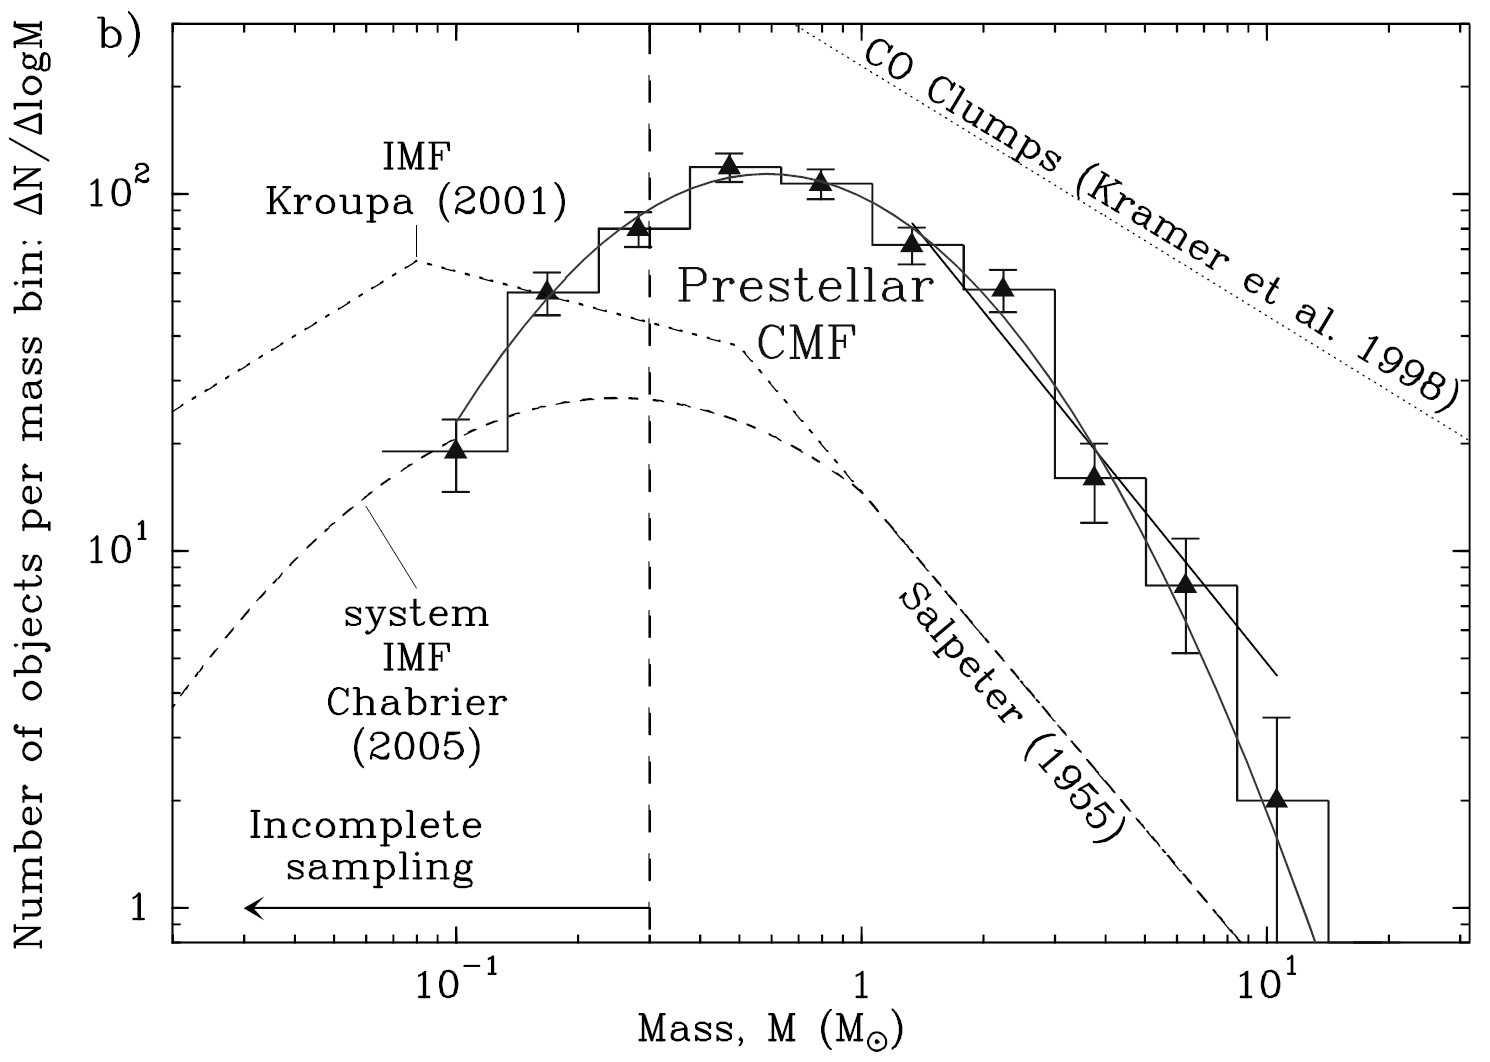
Filament formation – a 'missing link' in the star formation processes
From \(\sim100\)pc GMCs to \(<0.1\)pc prestellar cores
A giant leap in the spatical scale
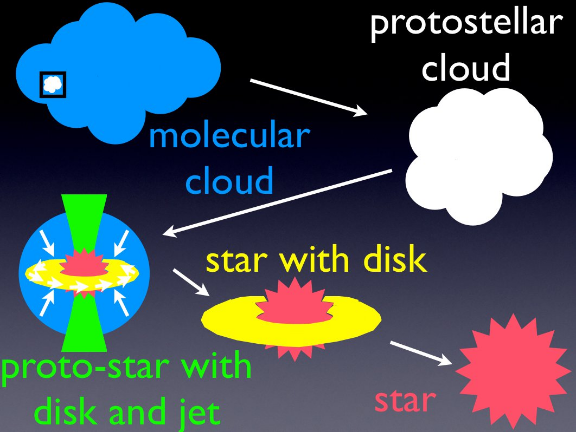
http://www.astro.washington.edu/users/sjschmidt/A101/lectures.html
Necessity for the large spatial dynamic range in the observations
From \(>100\)pc GMCs to \(<0.1\)pc prestellar cores
\(>10^3\) difference in spatial scales
Obs. with high spatial resolution & spatially extended emission – "spatial dynamic range"
↓
Advantage of the AKARI All-sky Survey
Filament extraction @ Taurus
Filament typical width: \(\sim 0.1\) pc \(\Leftrightarrow\) \(2.5'\) @ 140pc
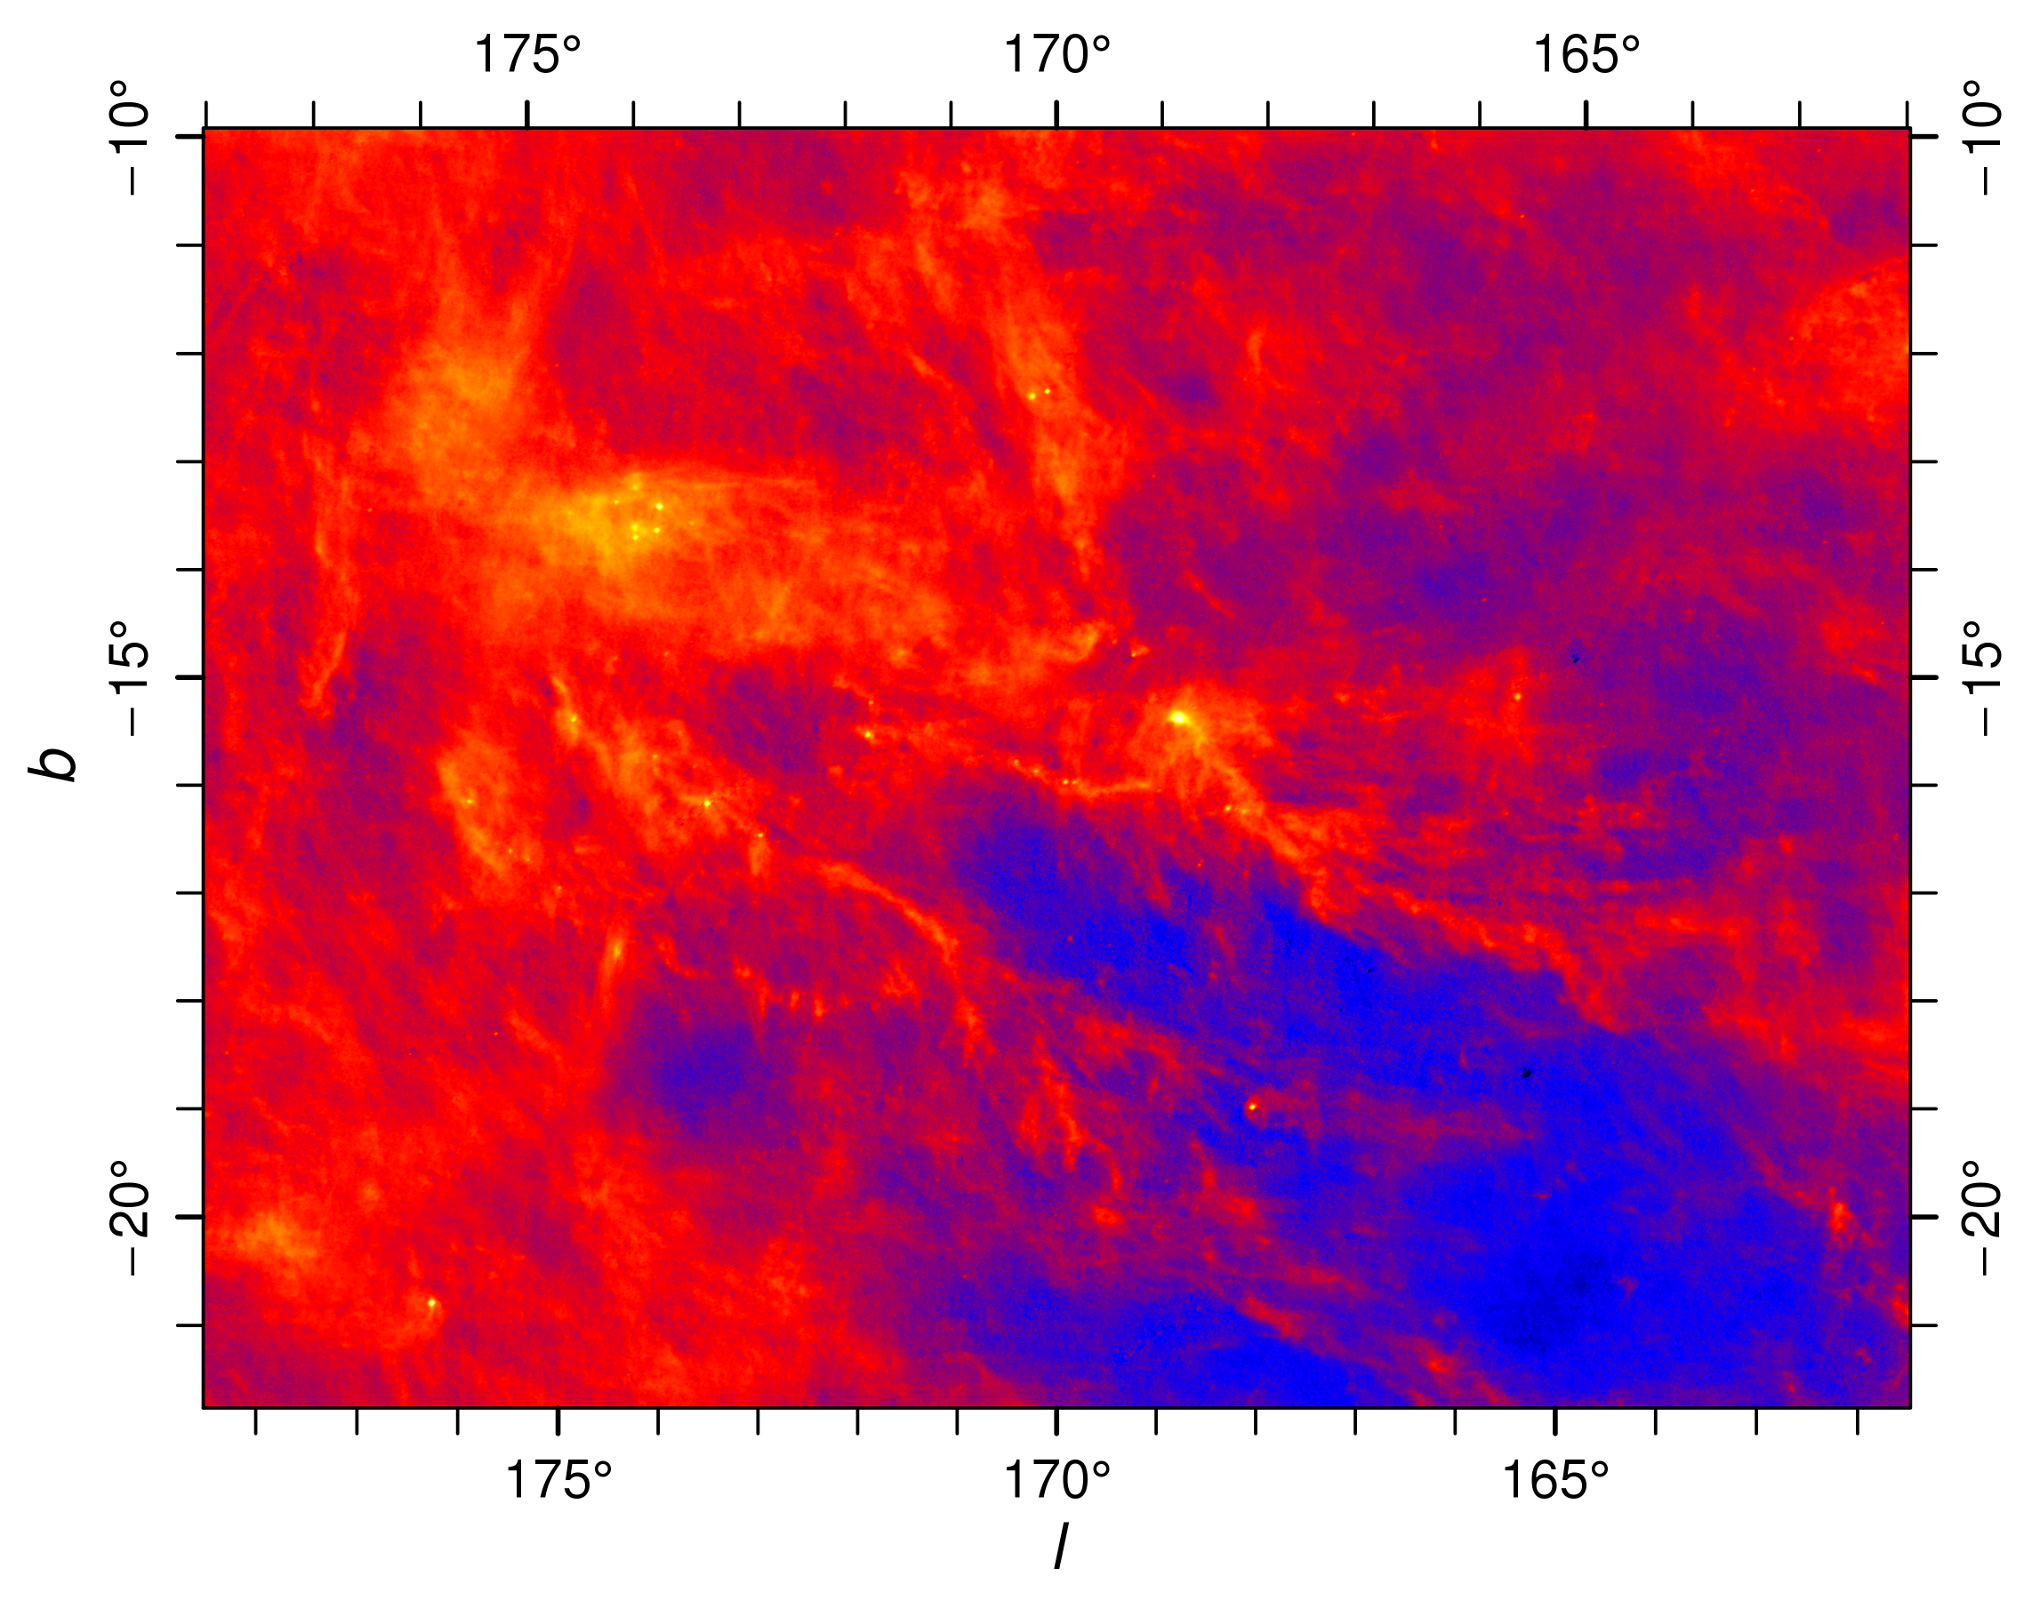
Filament extraction @ Taurus
Filament typical width: \(\sim 0.1\) pc \(\Leftrightarrow\) \(2.5'\) @ 140pc
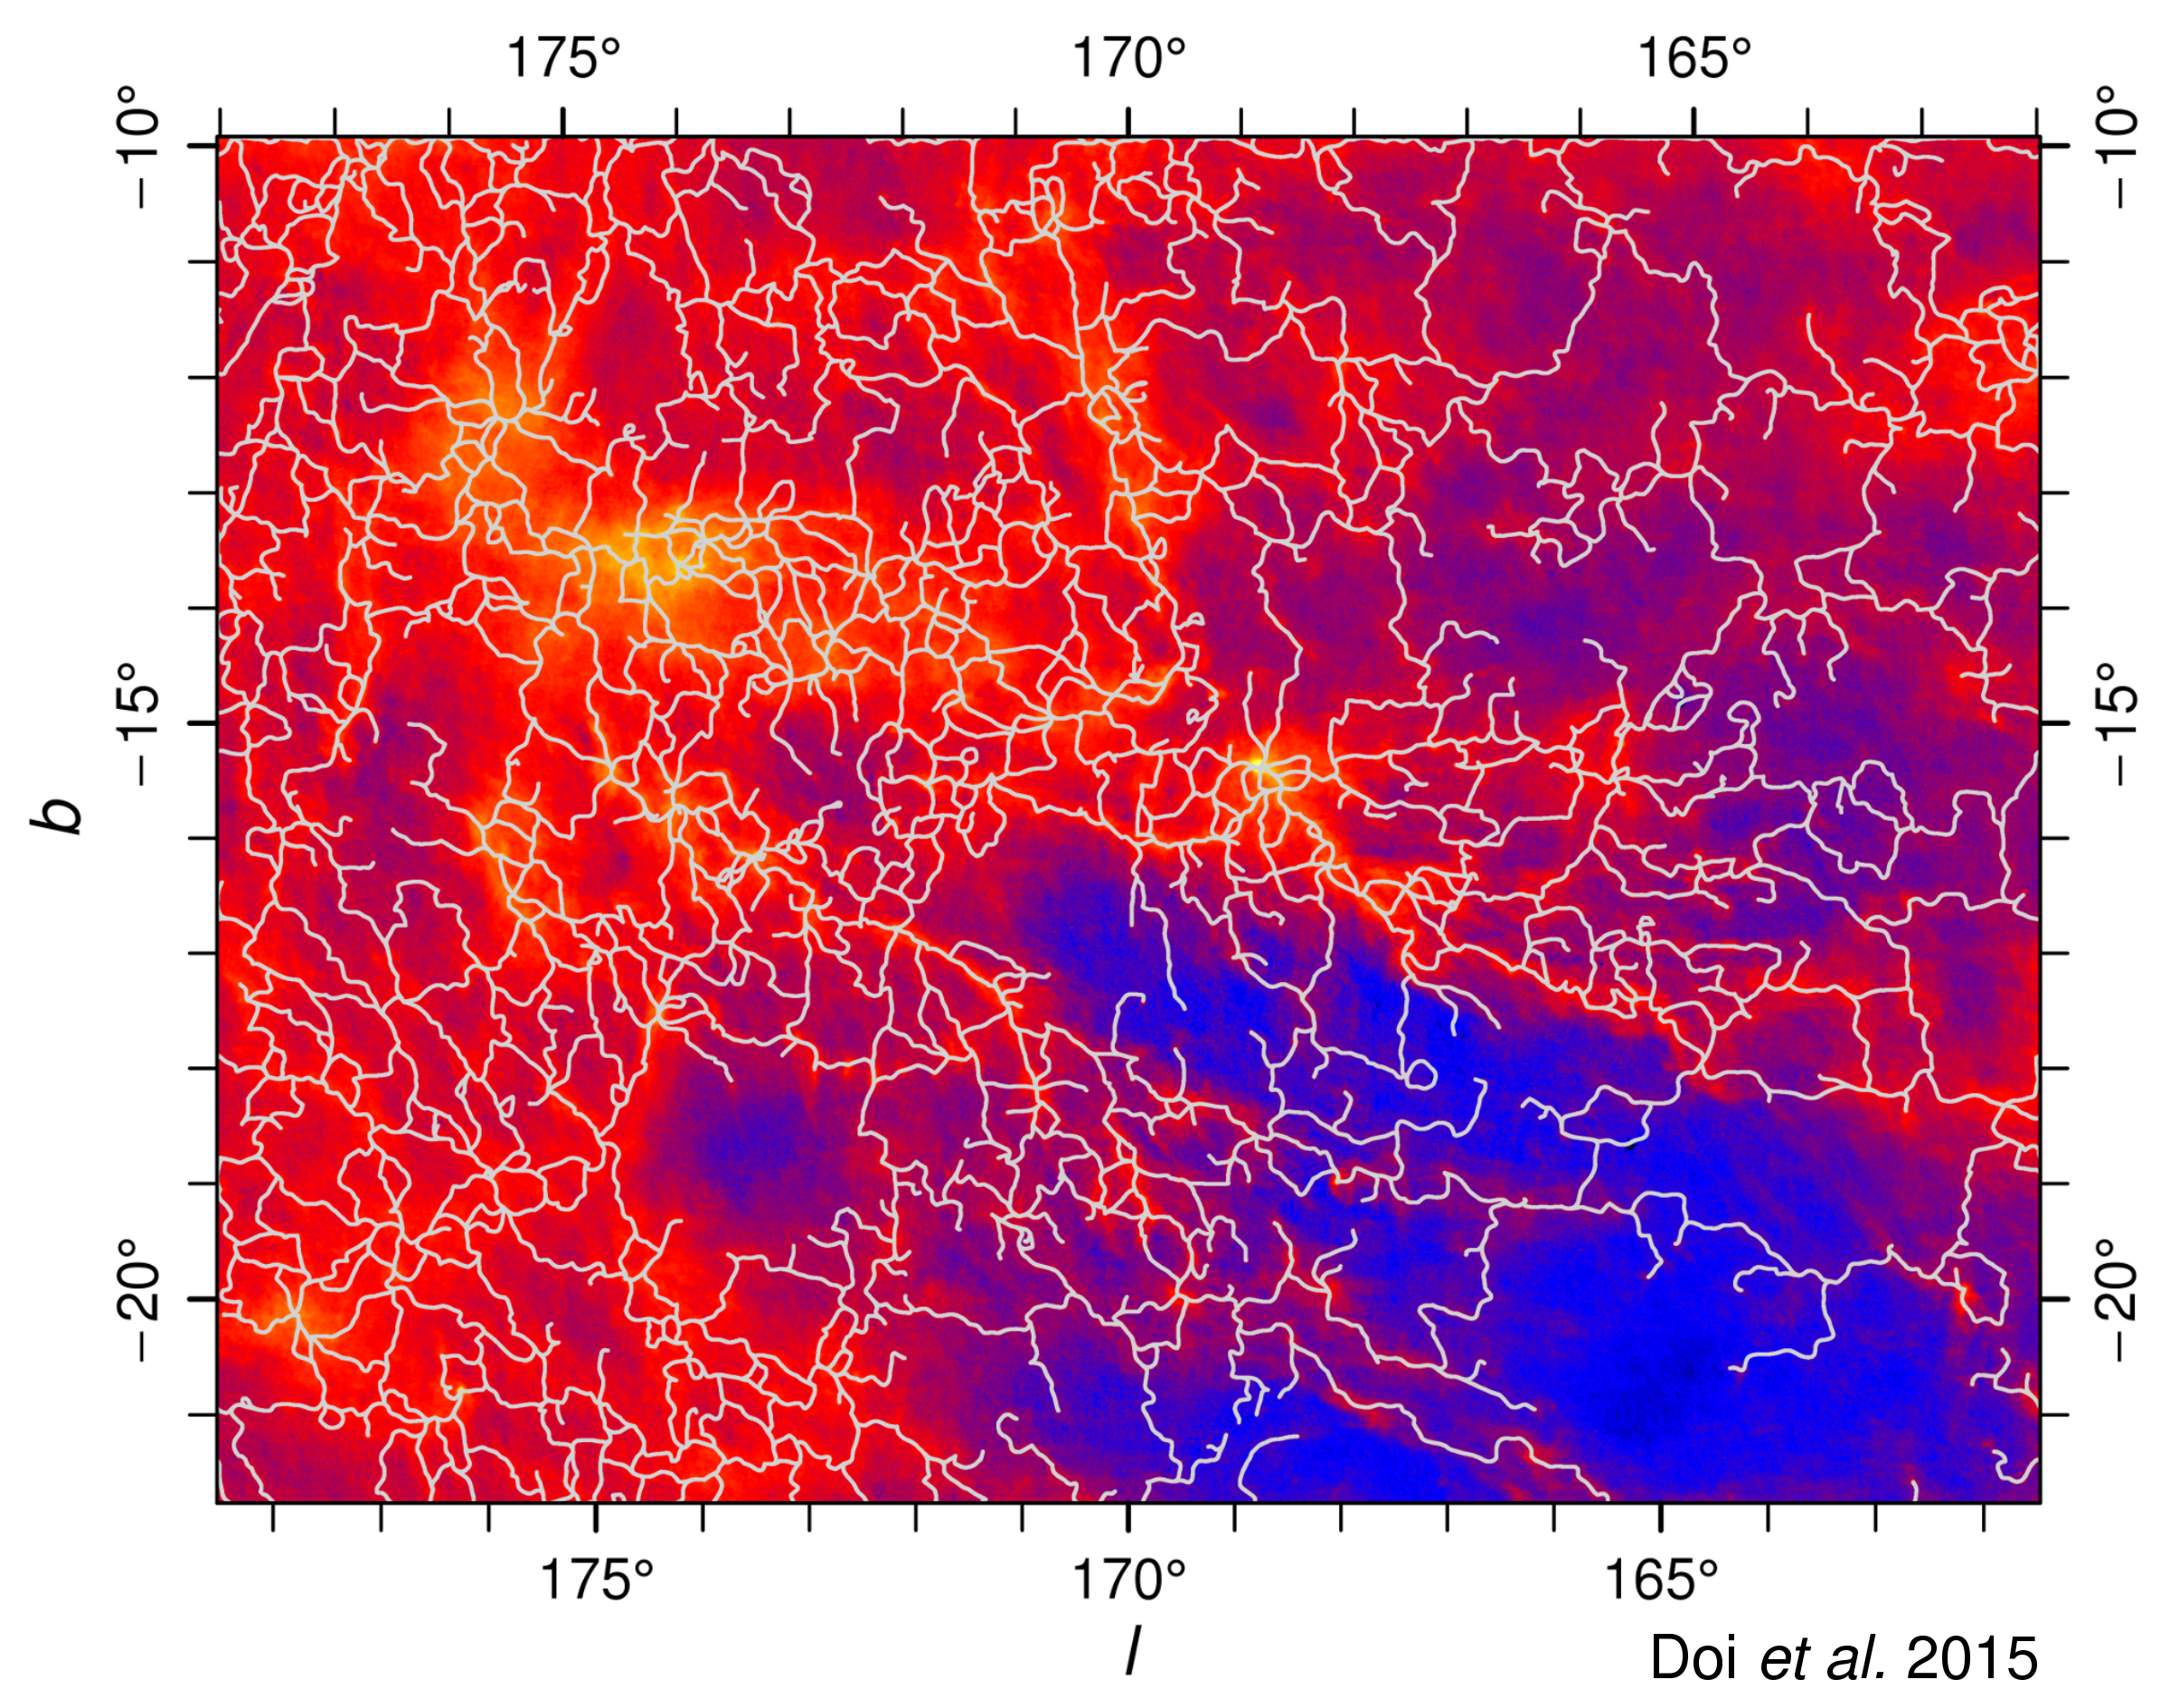
Filament extraction methods
- DisPerSE (Sousbie, 2011, MNRAS, 414, 350)
- Rolling Hough Transform (RHT; Clark et al. 2014 ApJ 789, 82)
- FilFinder (Koch et al. 2015, MNRAS, 452 (4), 3435)
These methods extract linearly elongated structure by design -- omit detailed structure of ISM.
Taurus YSOs
Filament typical width: \(\sim 0.1\) pc \(\Leftrightarrow\) \(2.5'\) @ 140pc
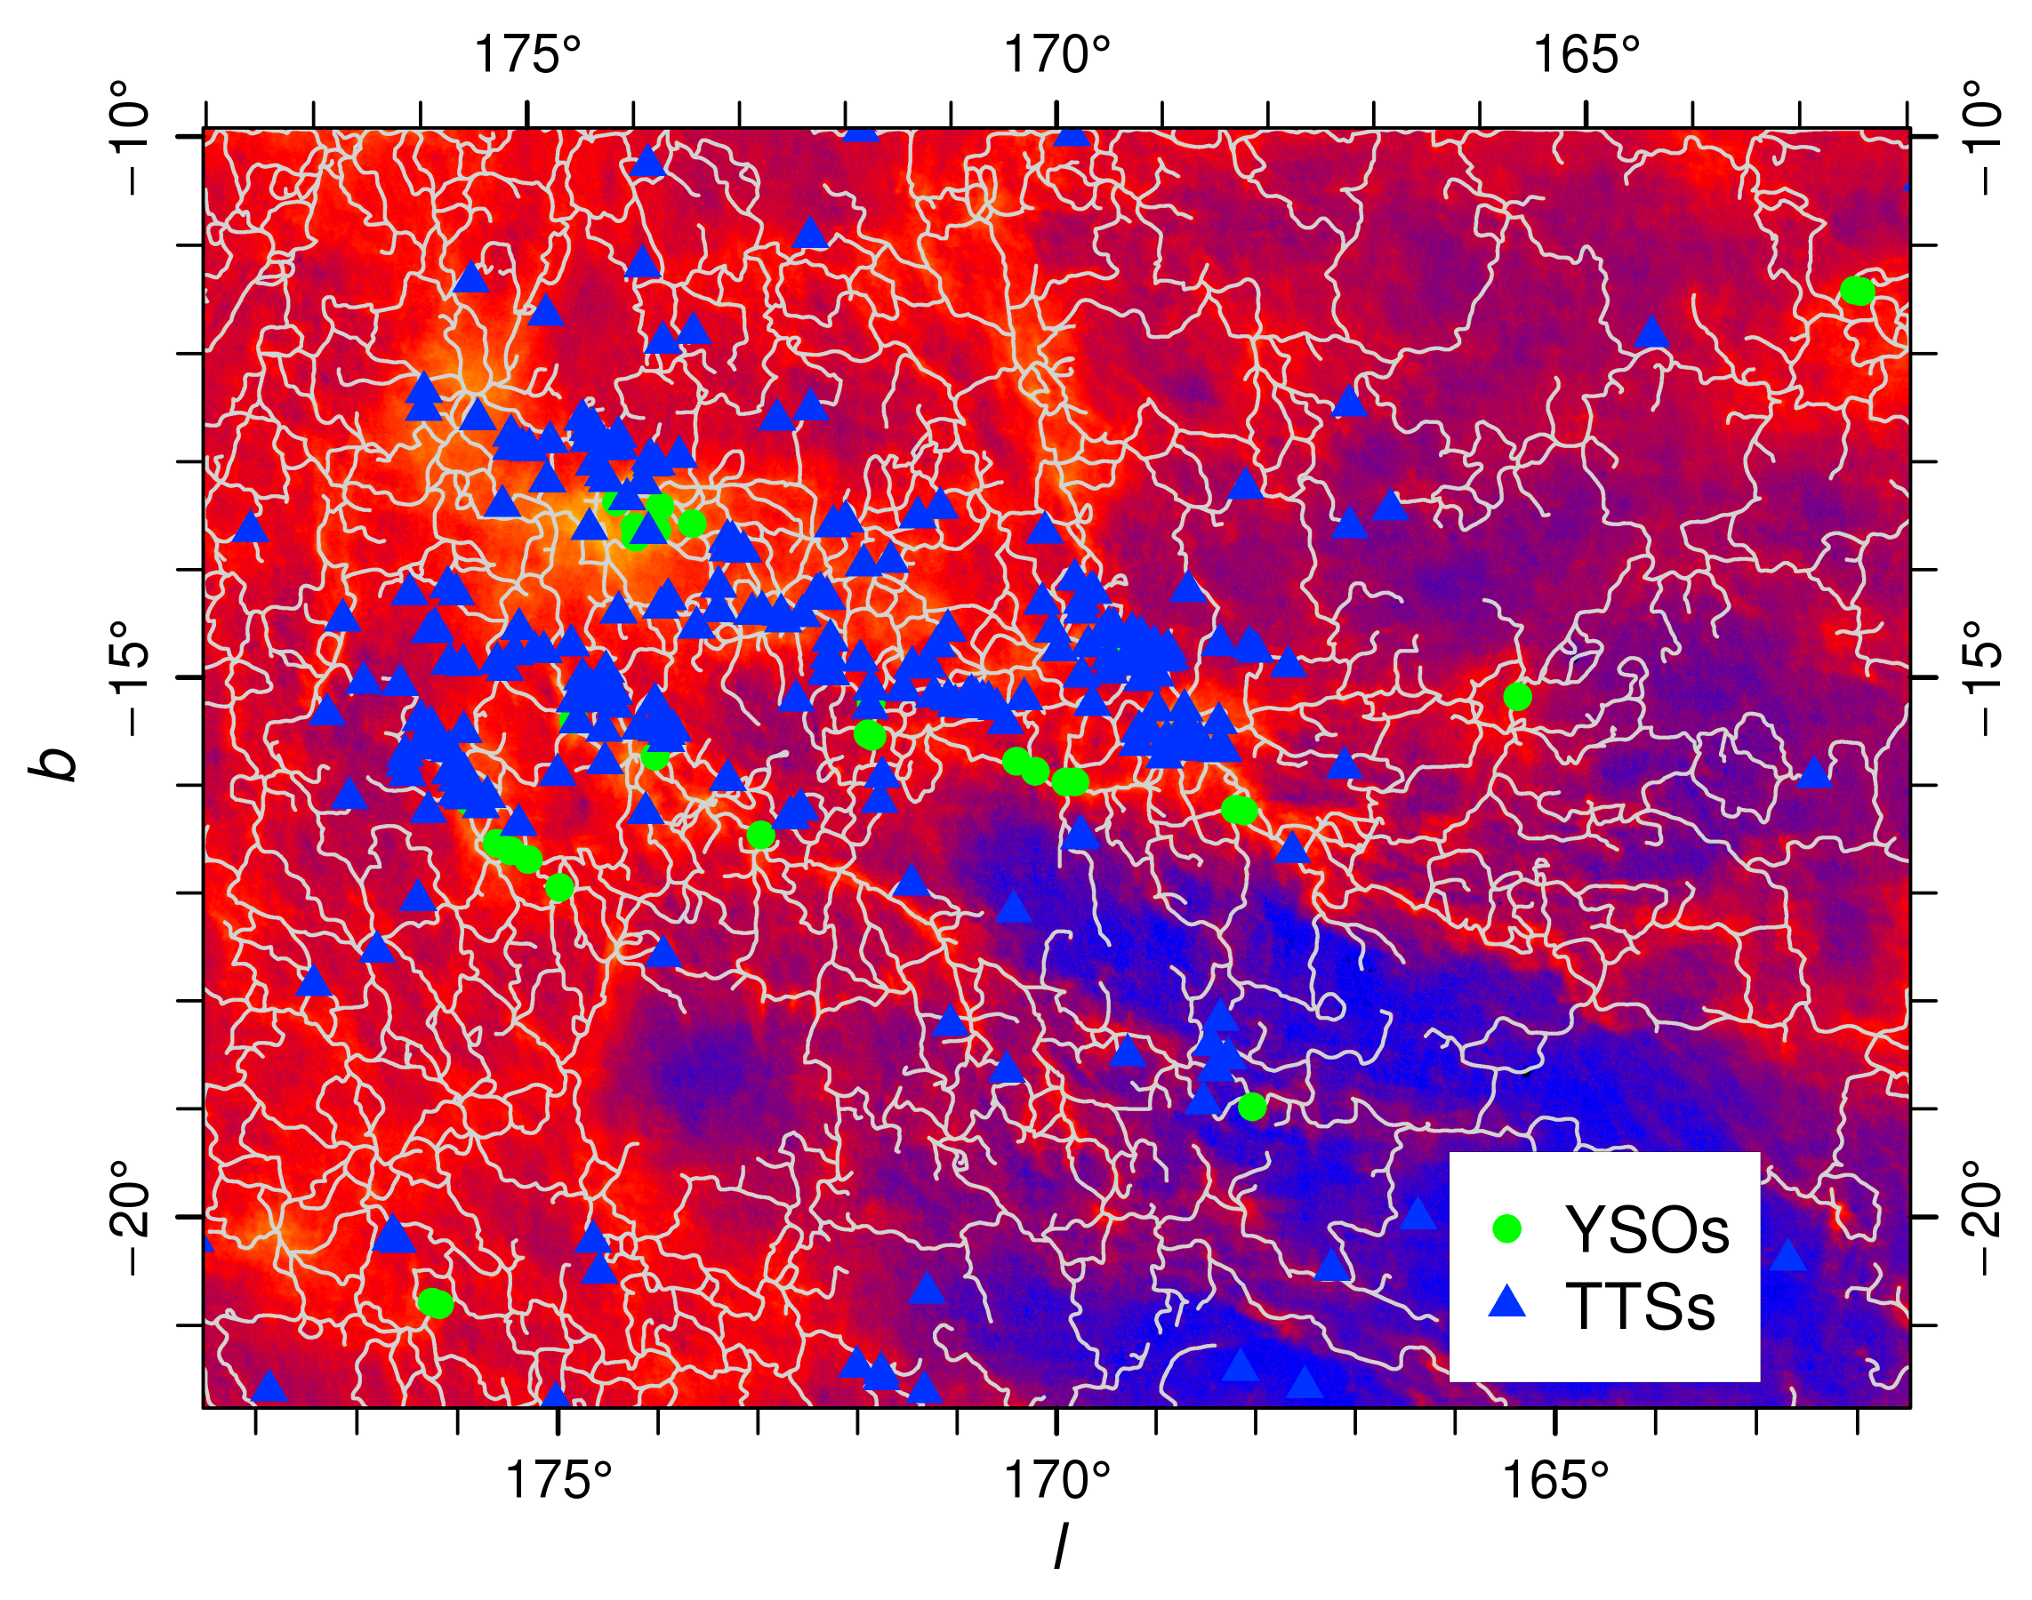
Taurus YSOs & TTSs correlation with filaments
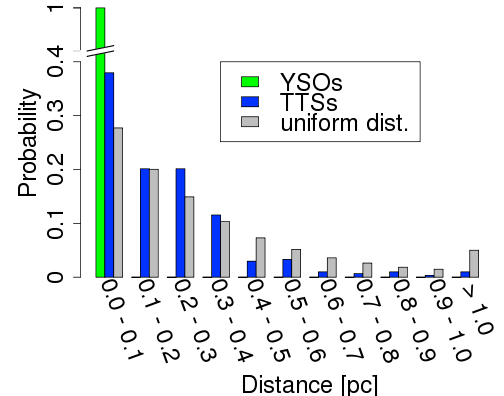
YSOs: all sources (30/30)
TTSs: significant concentration (p-value=0.004)
\(\leftrightarrow\) 0.1[km/s] random motion over \(1-5\times10^6\) yrs
Taurus TTSs distance from filaments
Filament extraction @ PolarisFlare
Filament typical width: \(\sim 0.1\) pc \(\Leftrightarrow\) \(1.7'\) @ 200pc
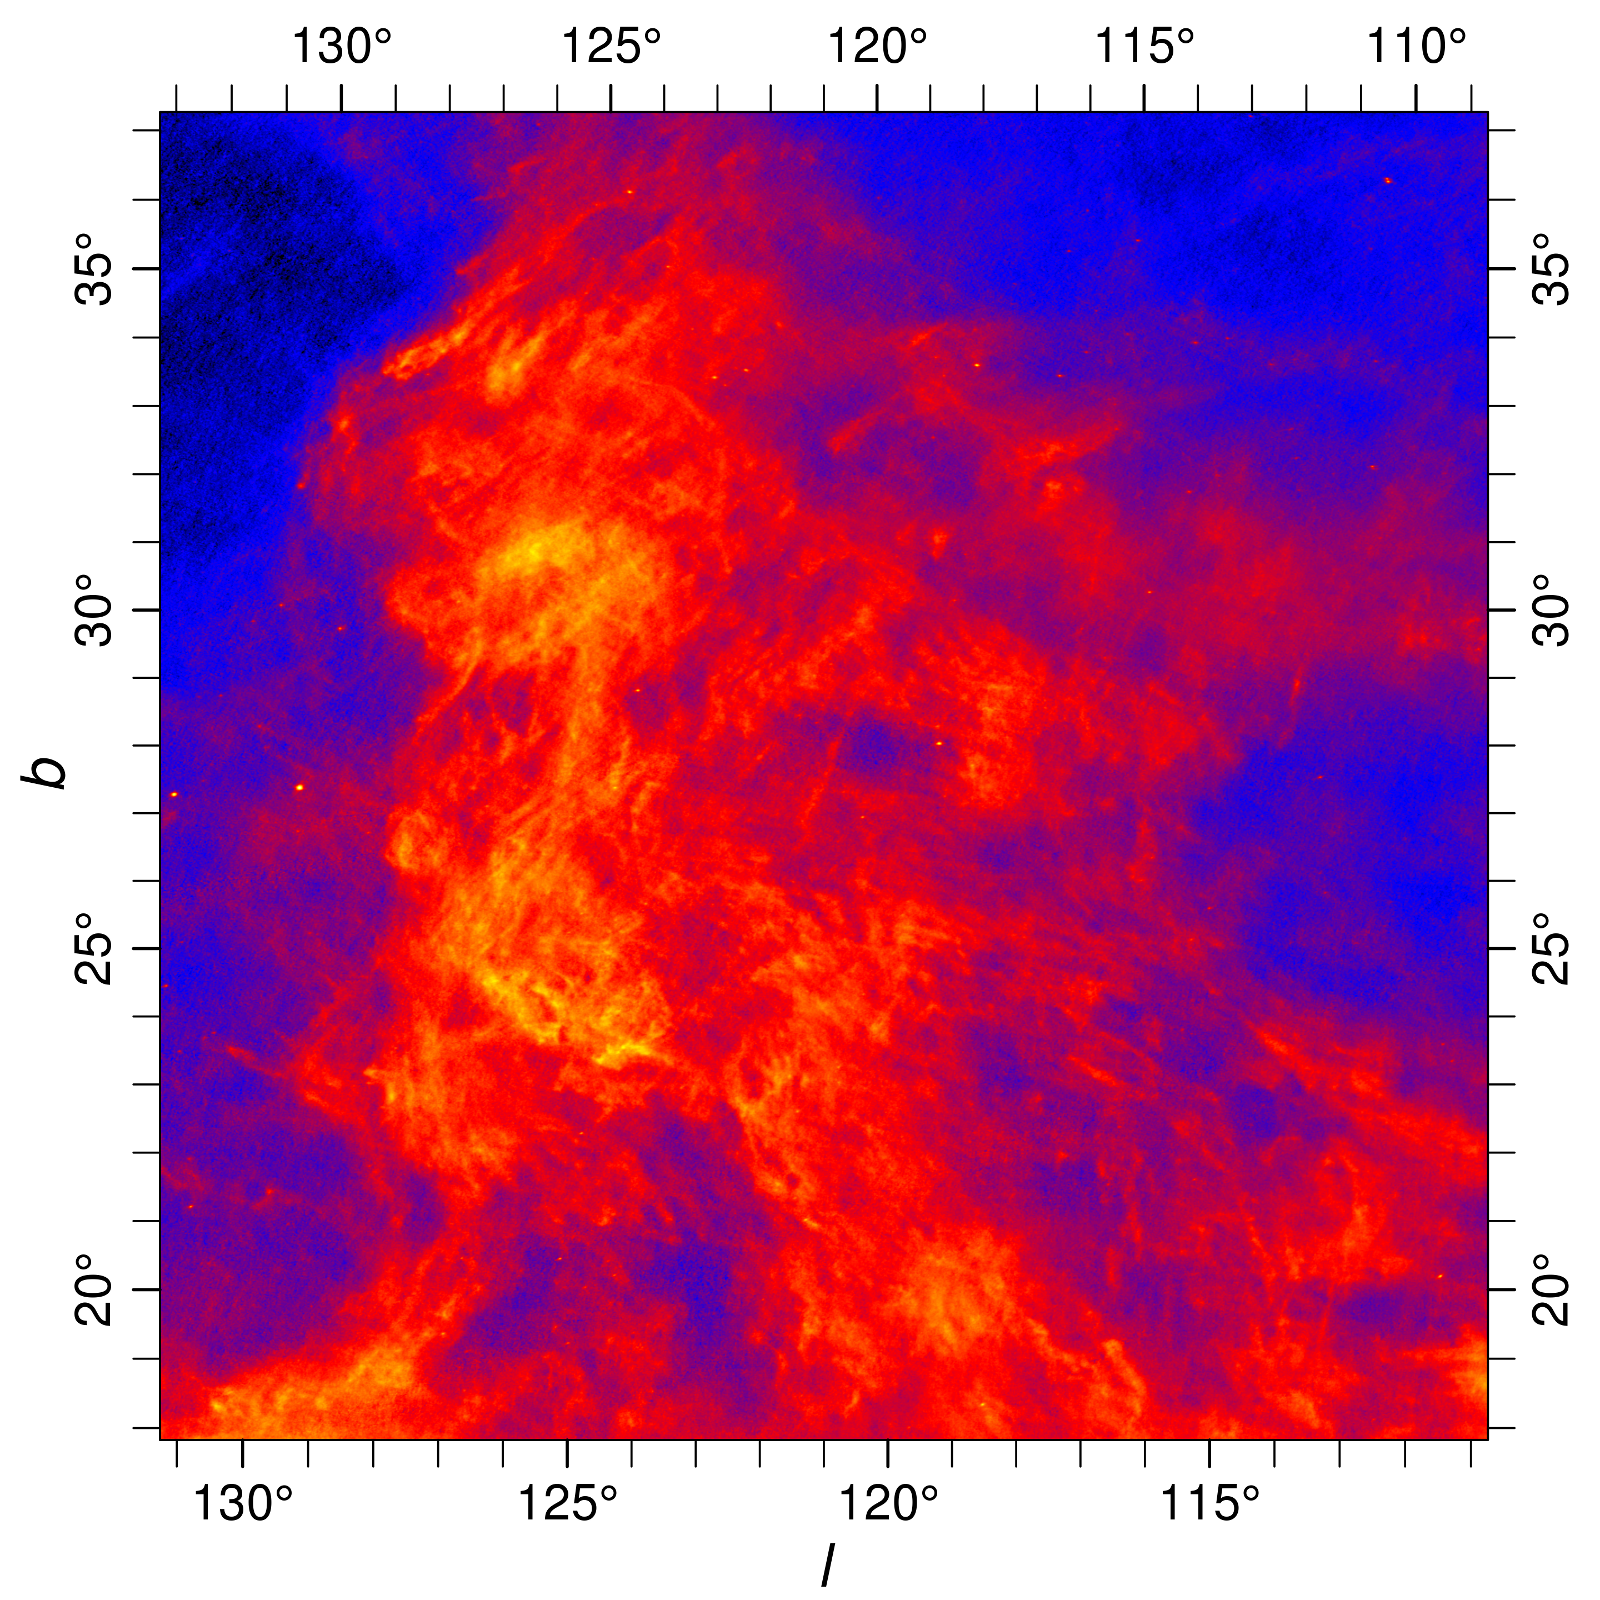
Filament extraction @ PolarisFlare
Filament typical width: \(\sim 0.1\) pc \(\Leftrightarrow\) \(1.7'\) @ 200pc
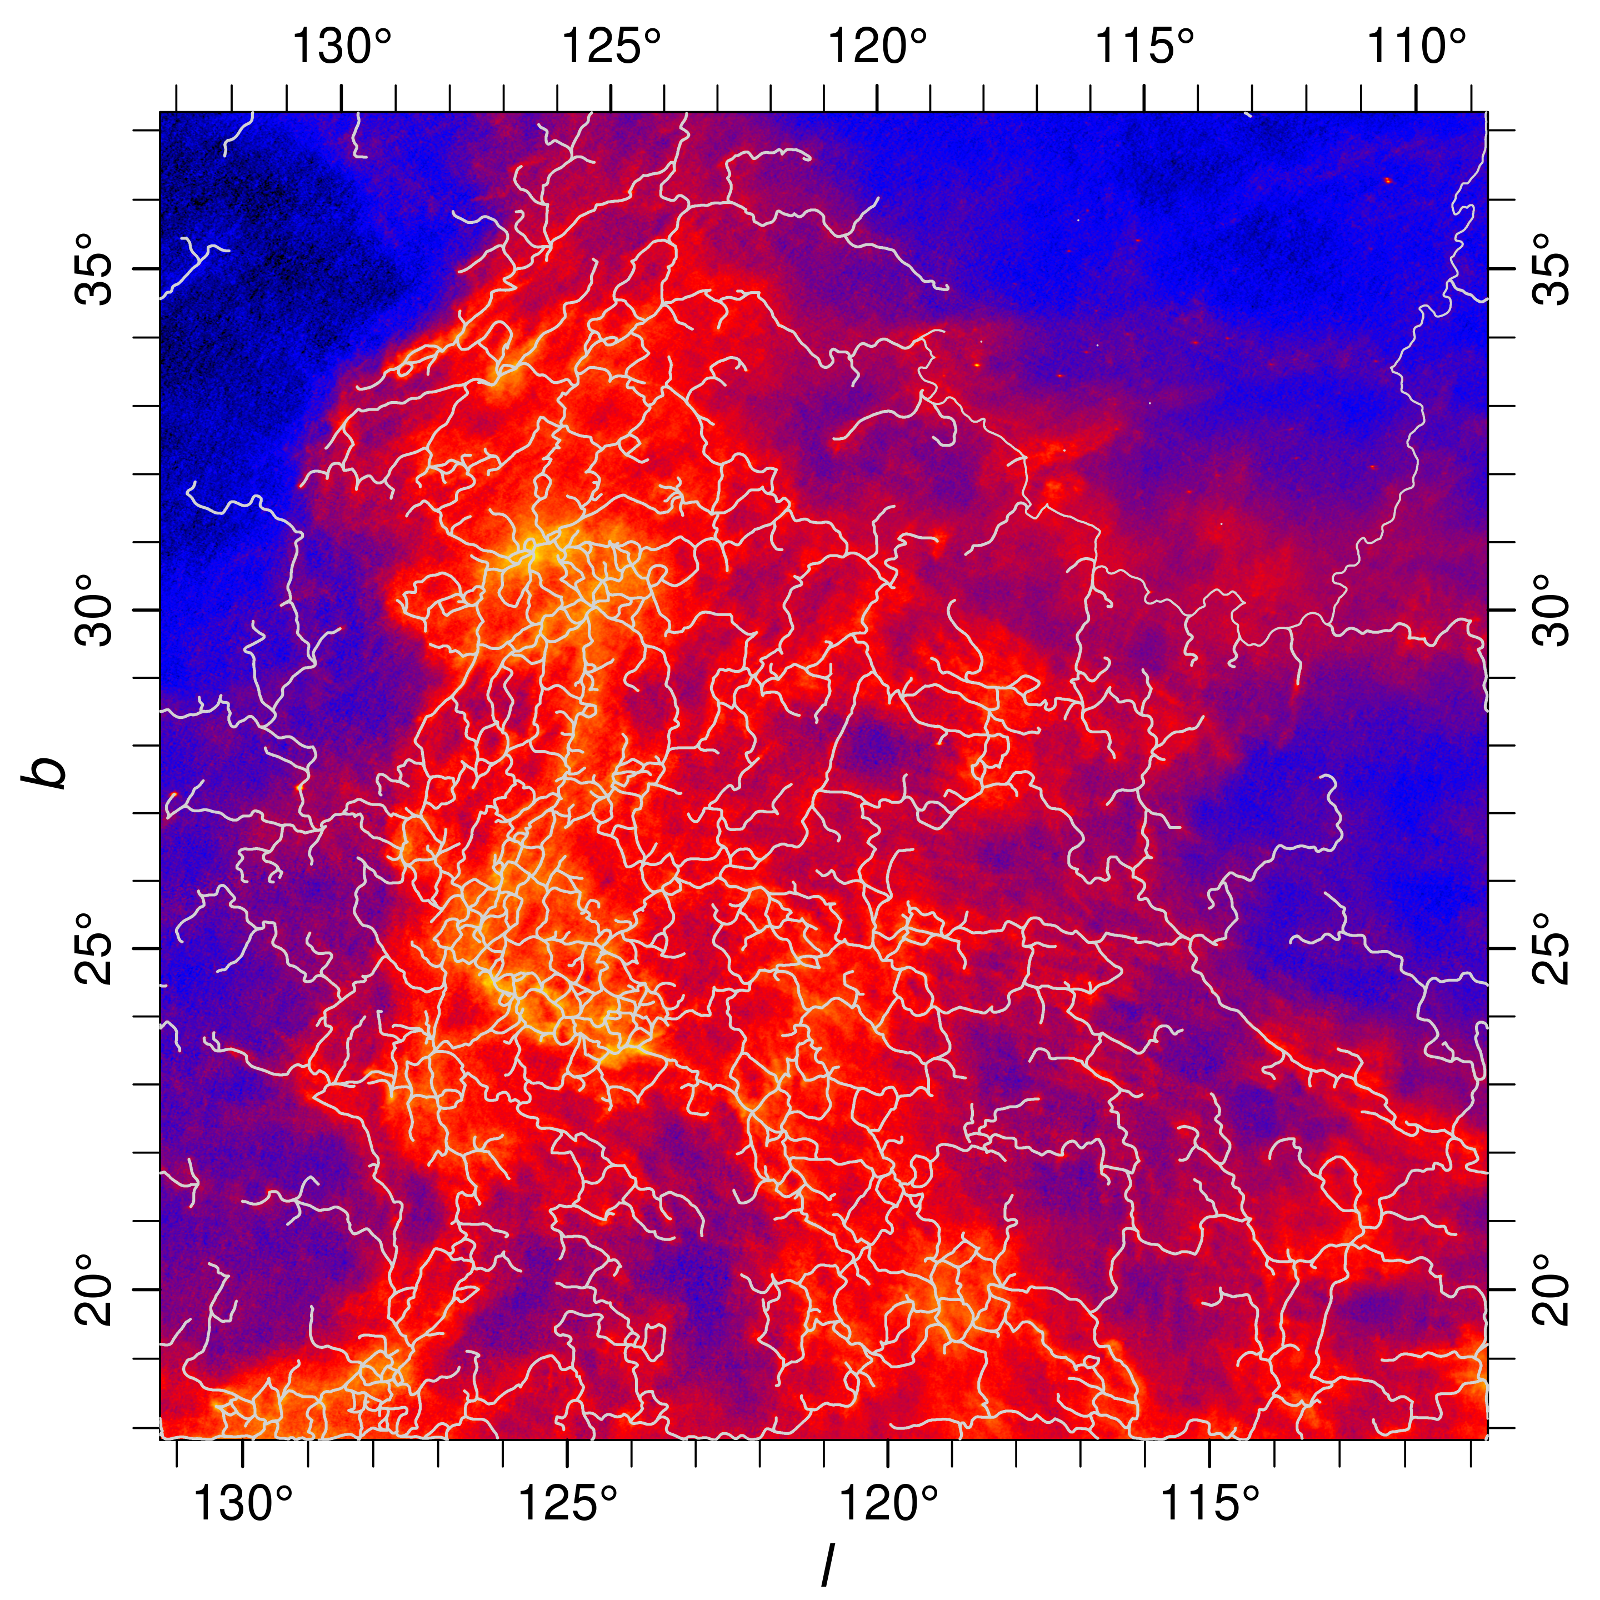
ISM structure identification
density-based clustering method
- estimate surface density of data points
- find data points above a threshold value
- background noise can be eliminated
- structure of clusters is not presupposed

(image from Wikipedia)
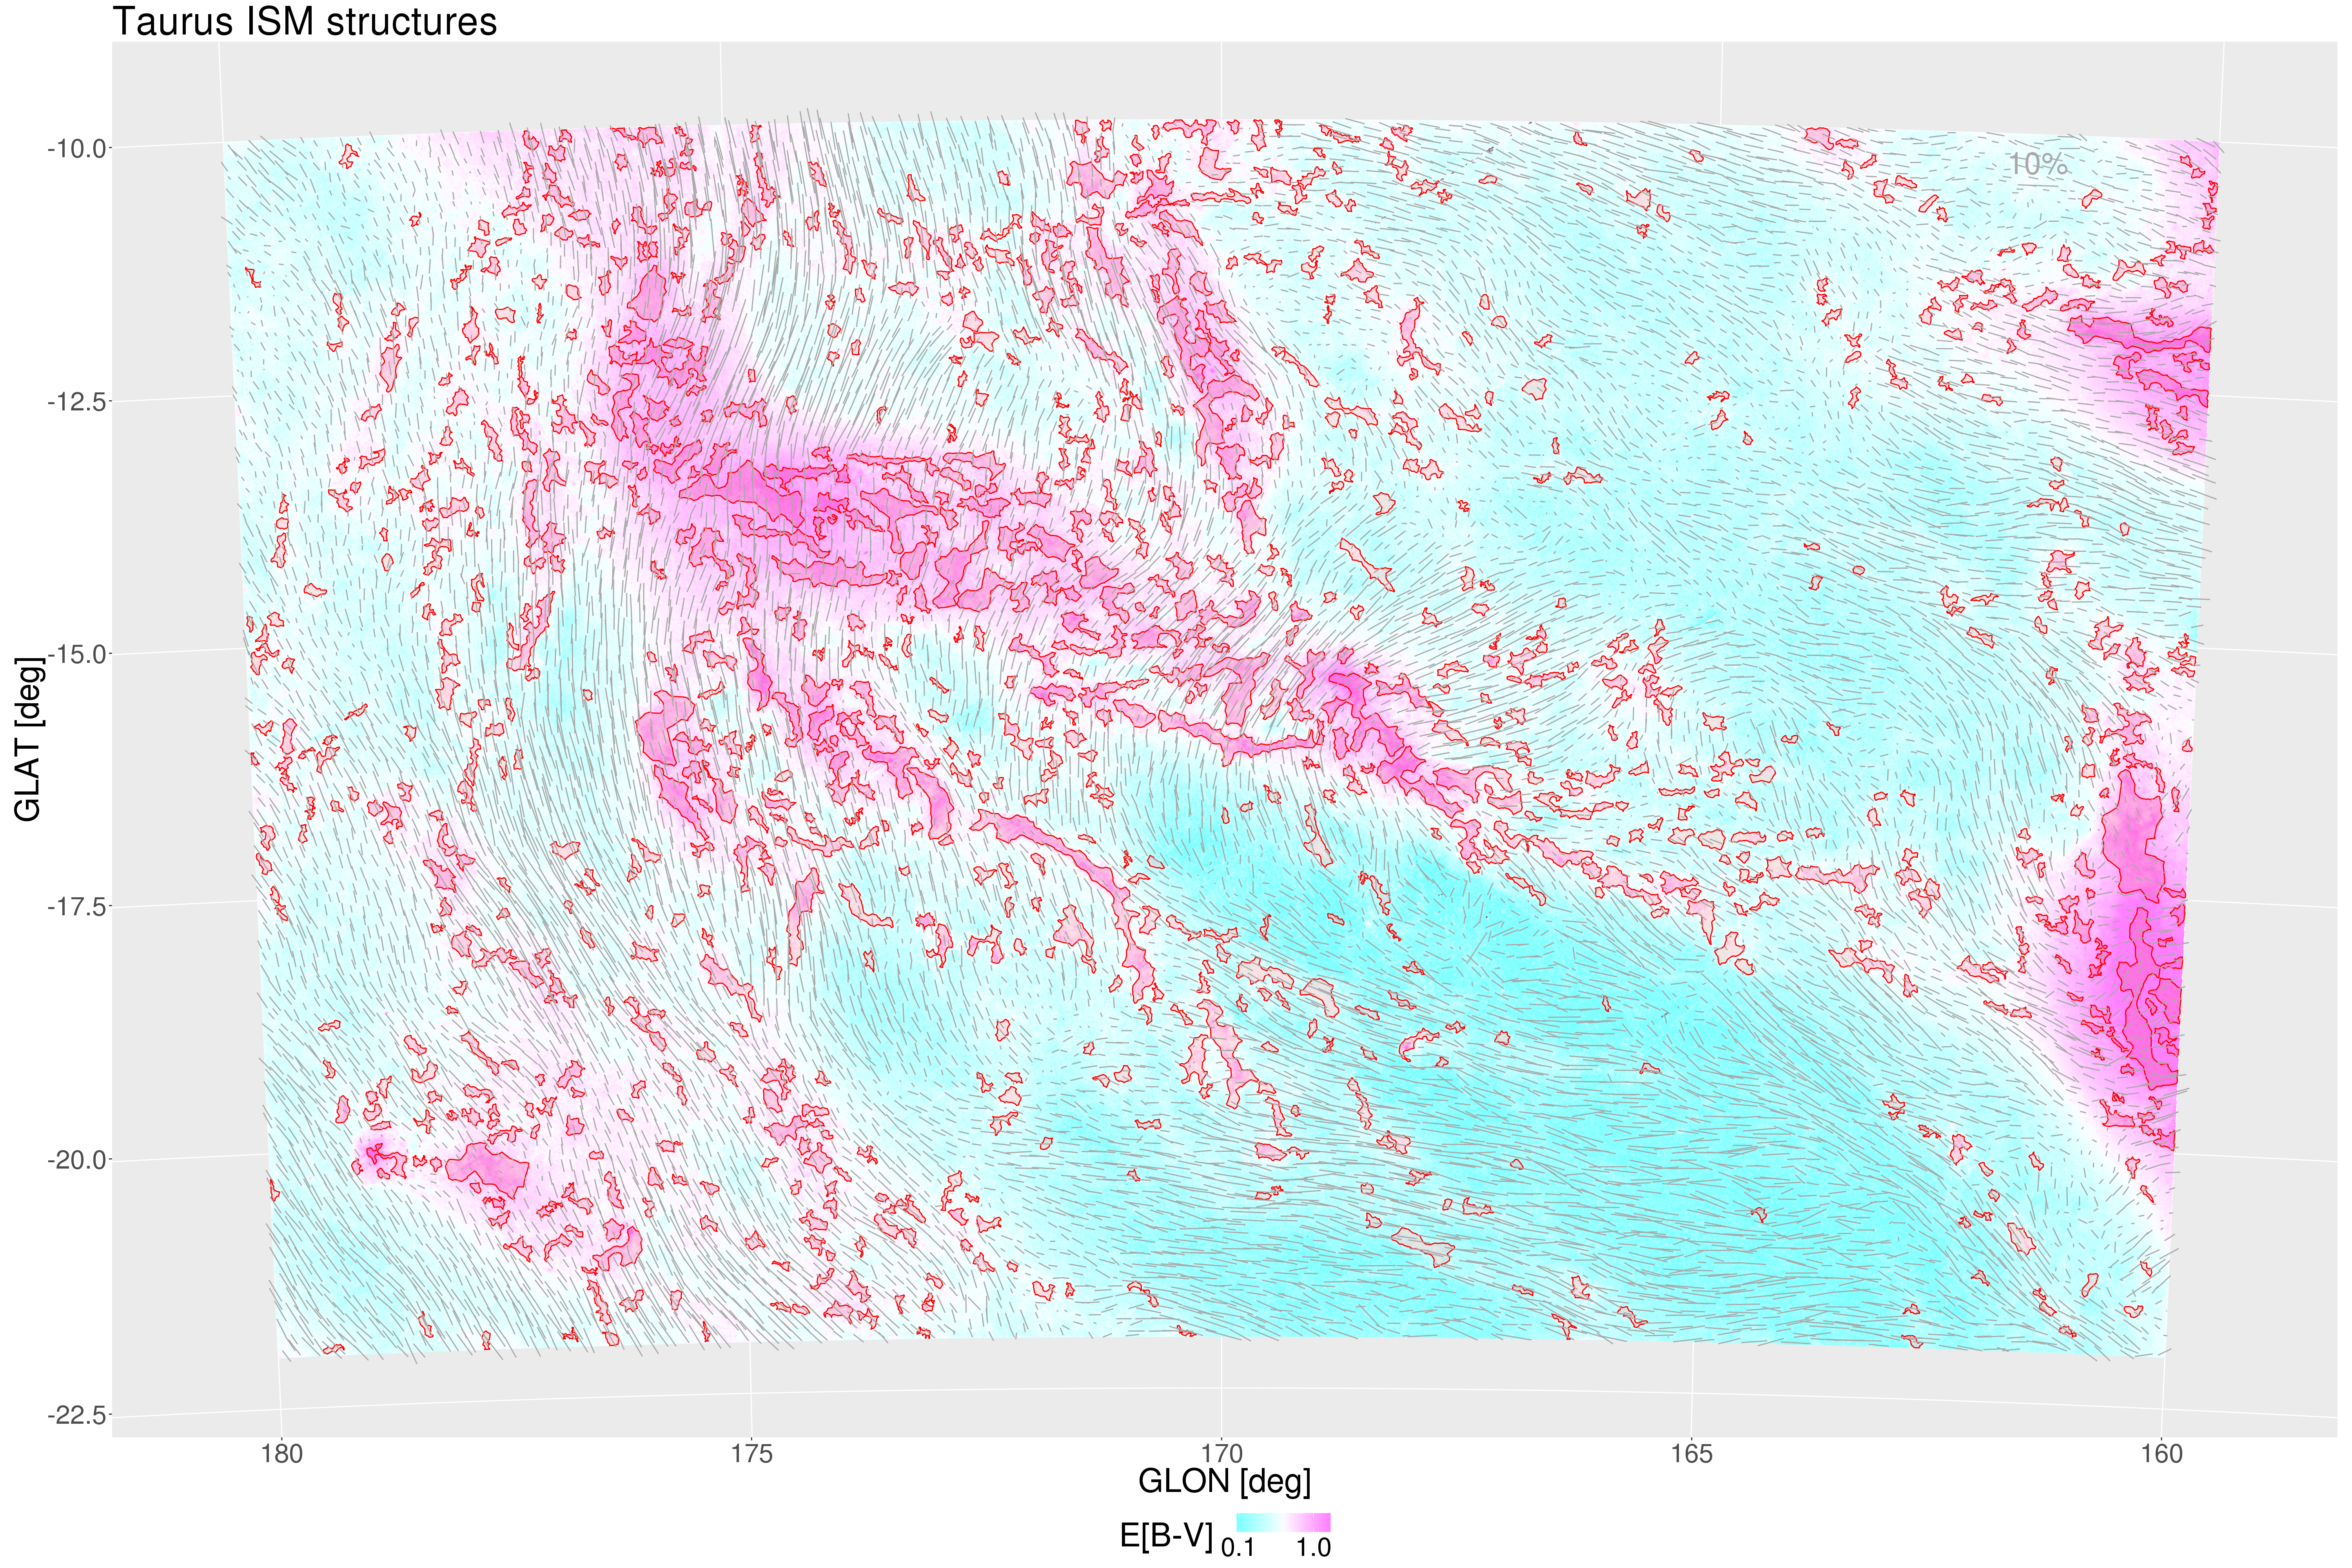
ISM structure identification in Taurus
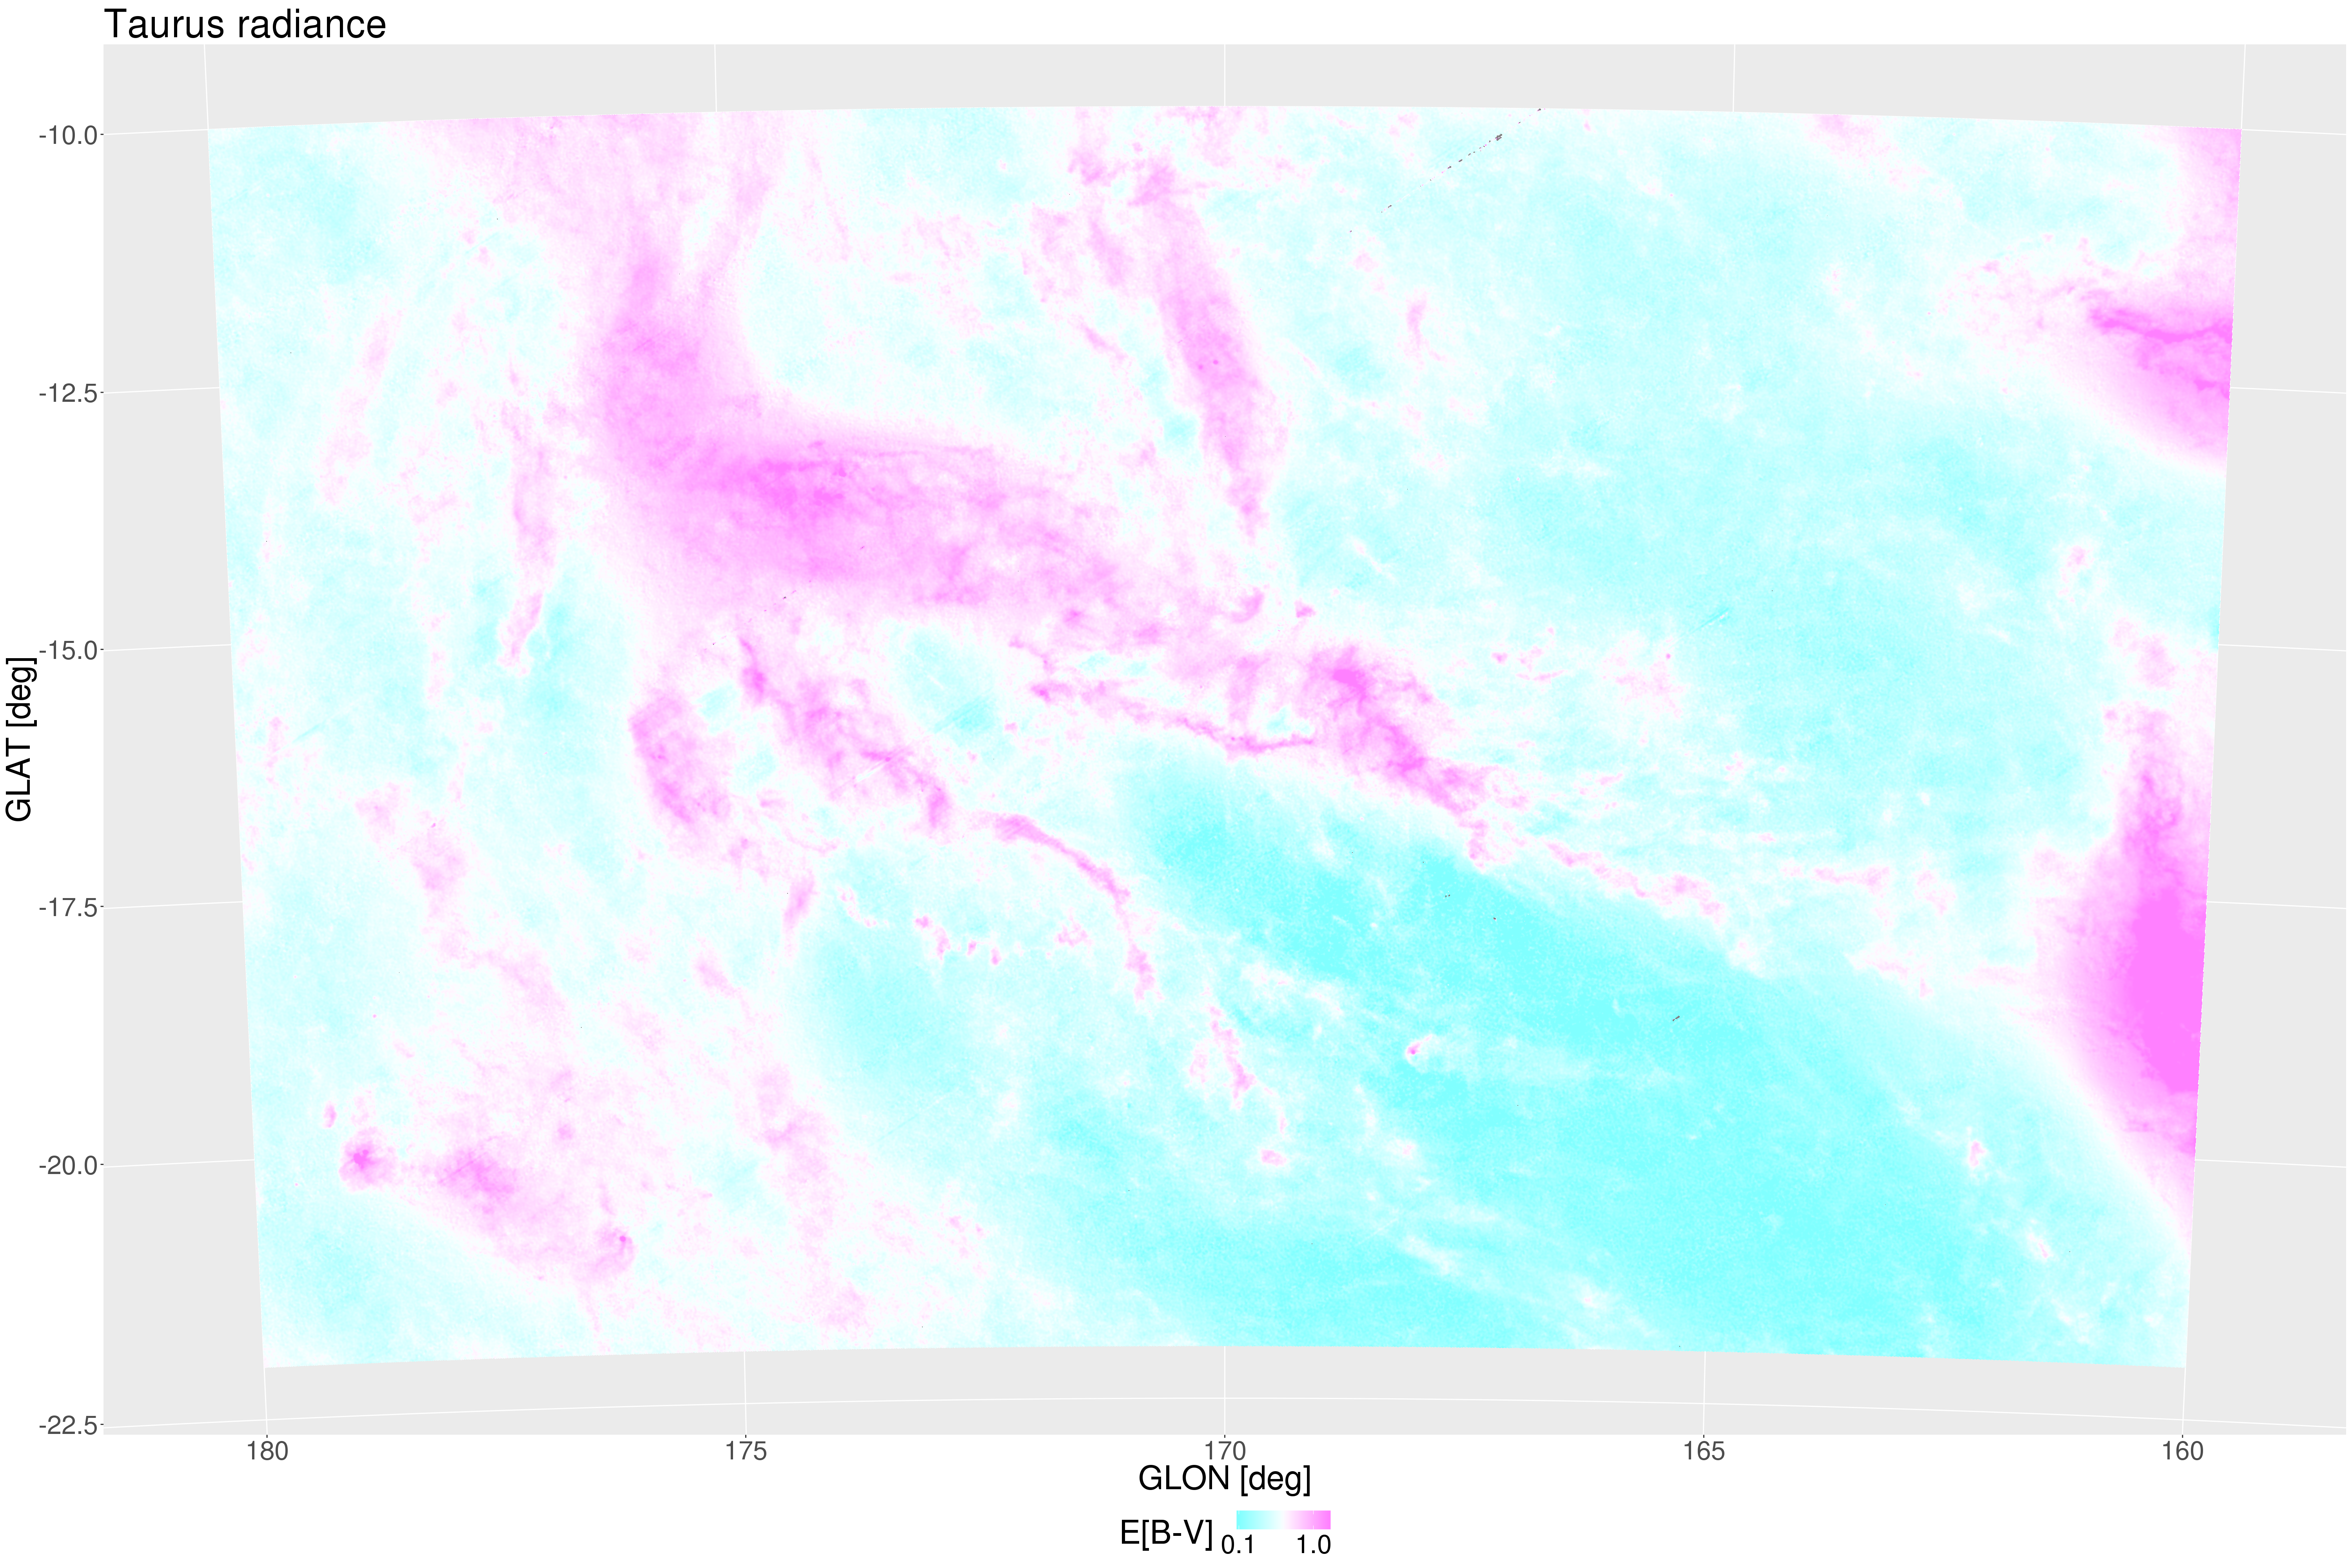
ISM structure identification in Taurus
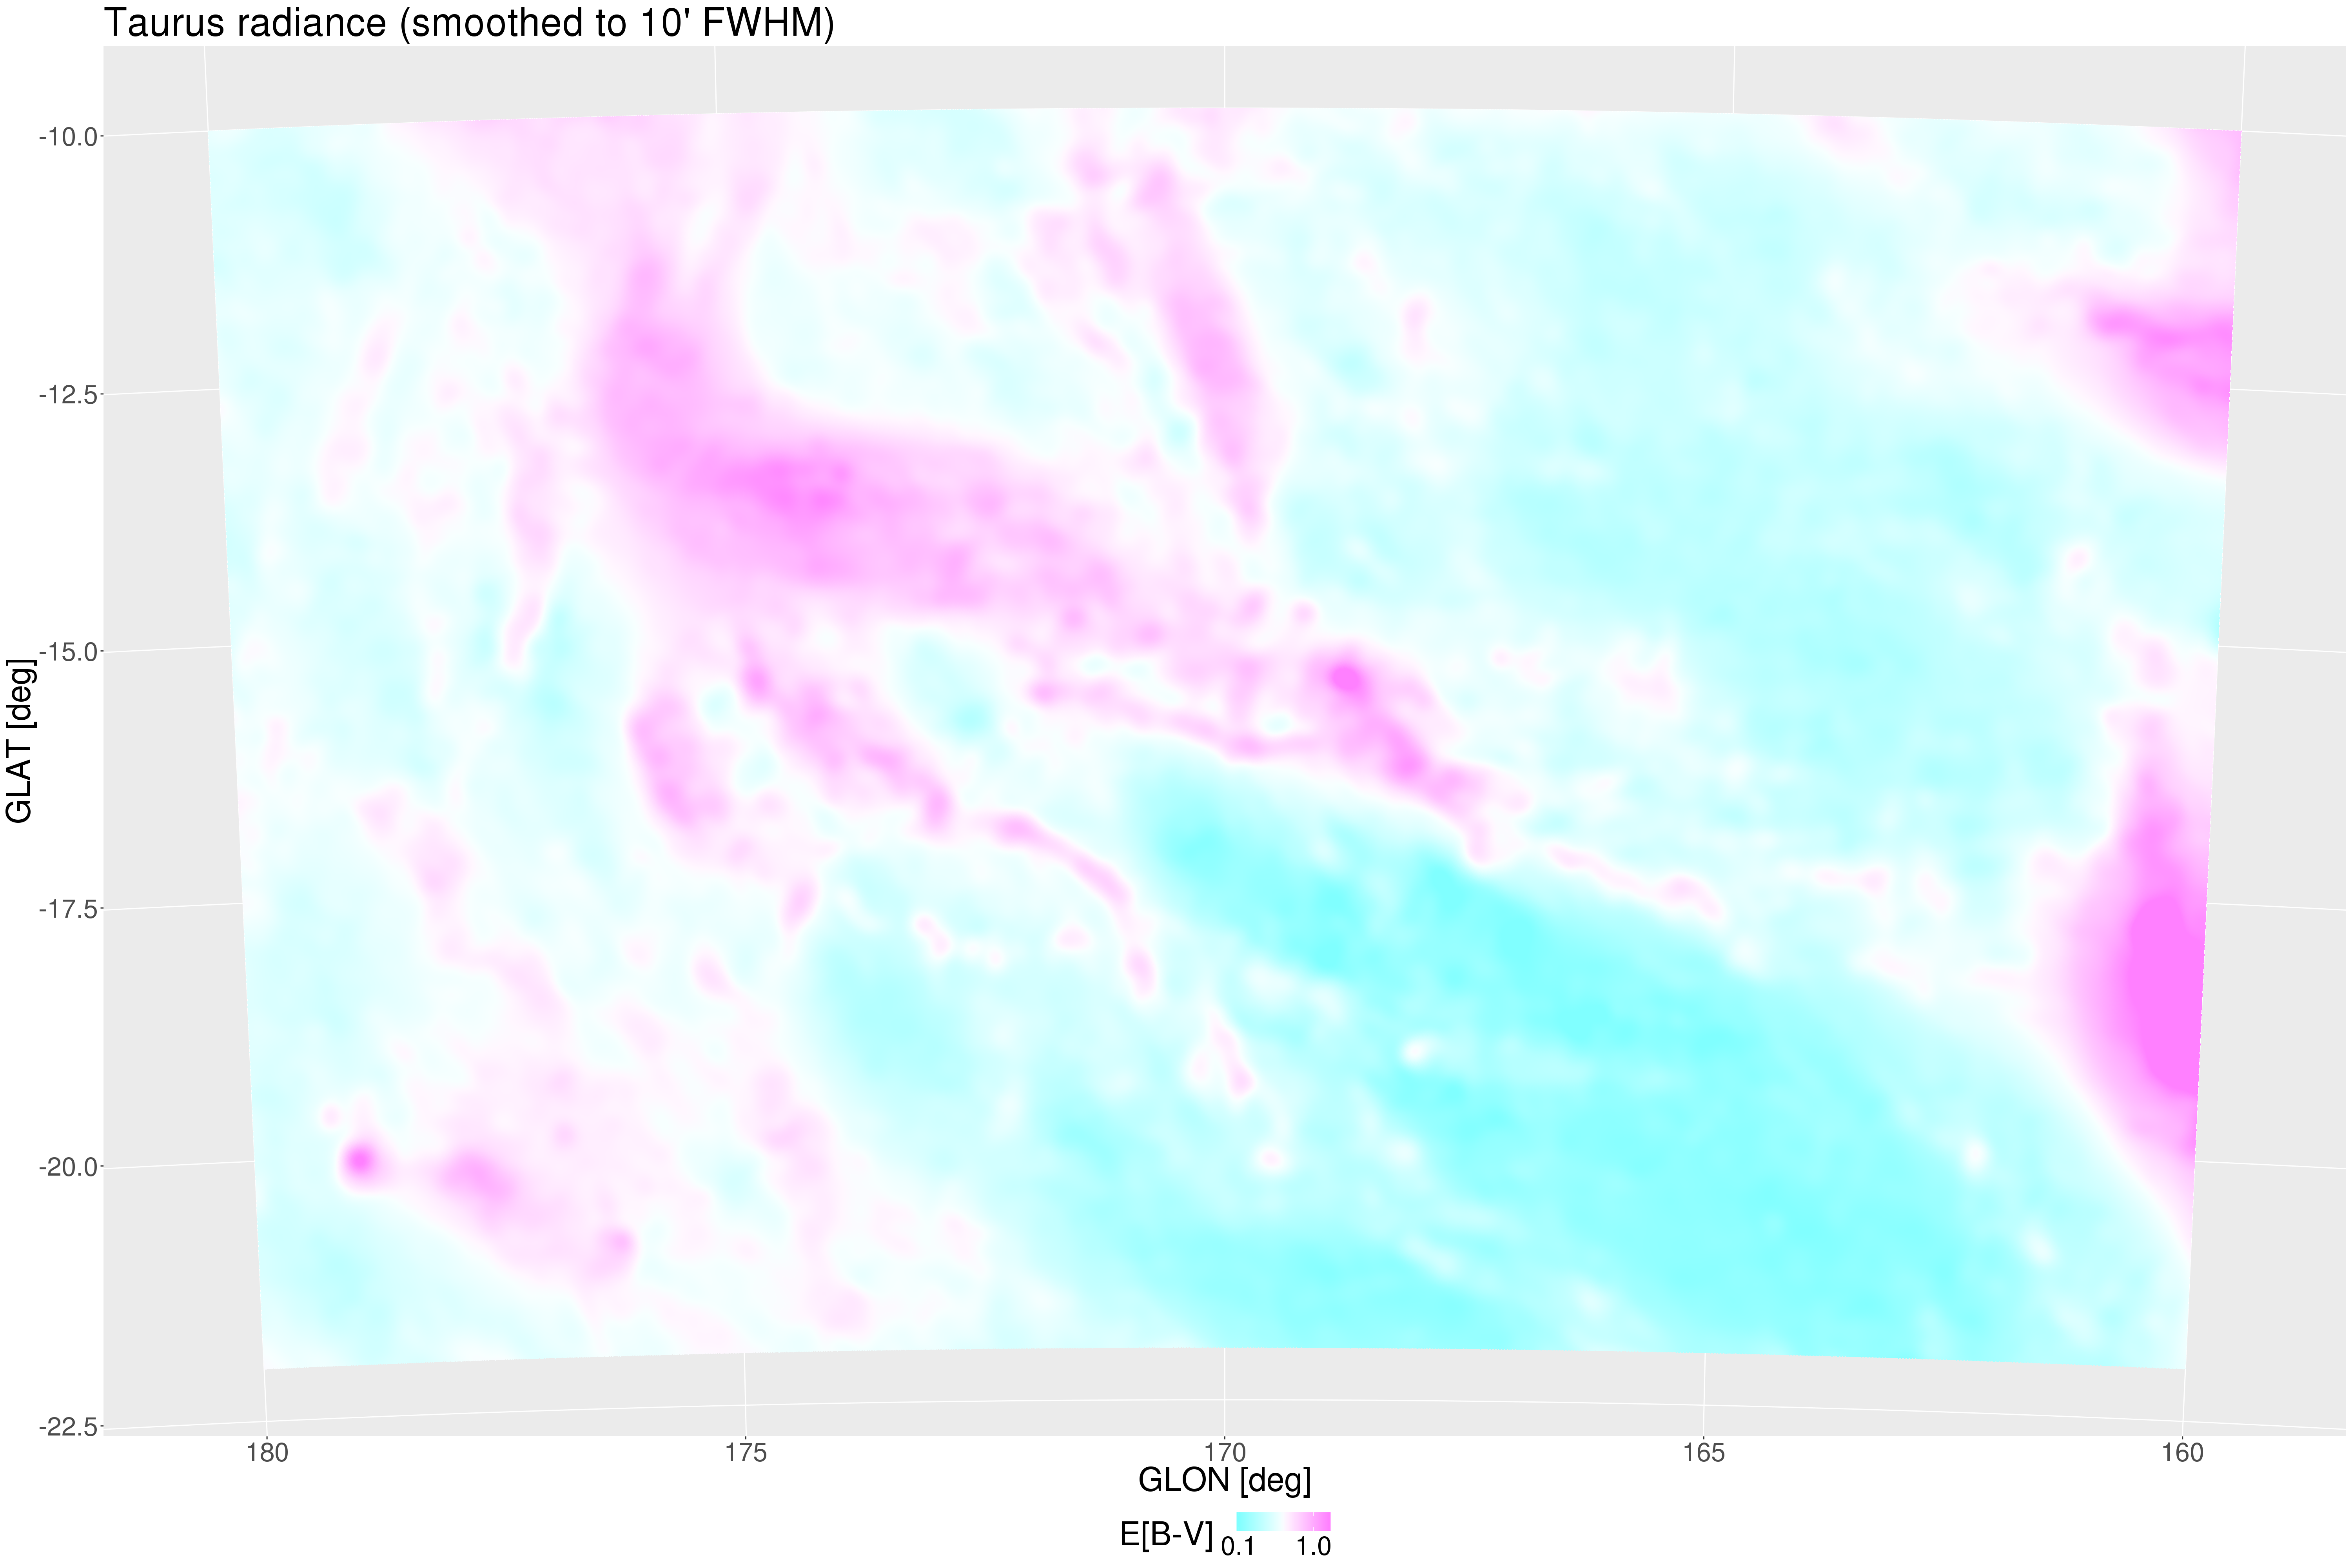
ISM structure identification in Taurus
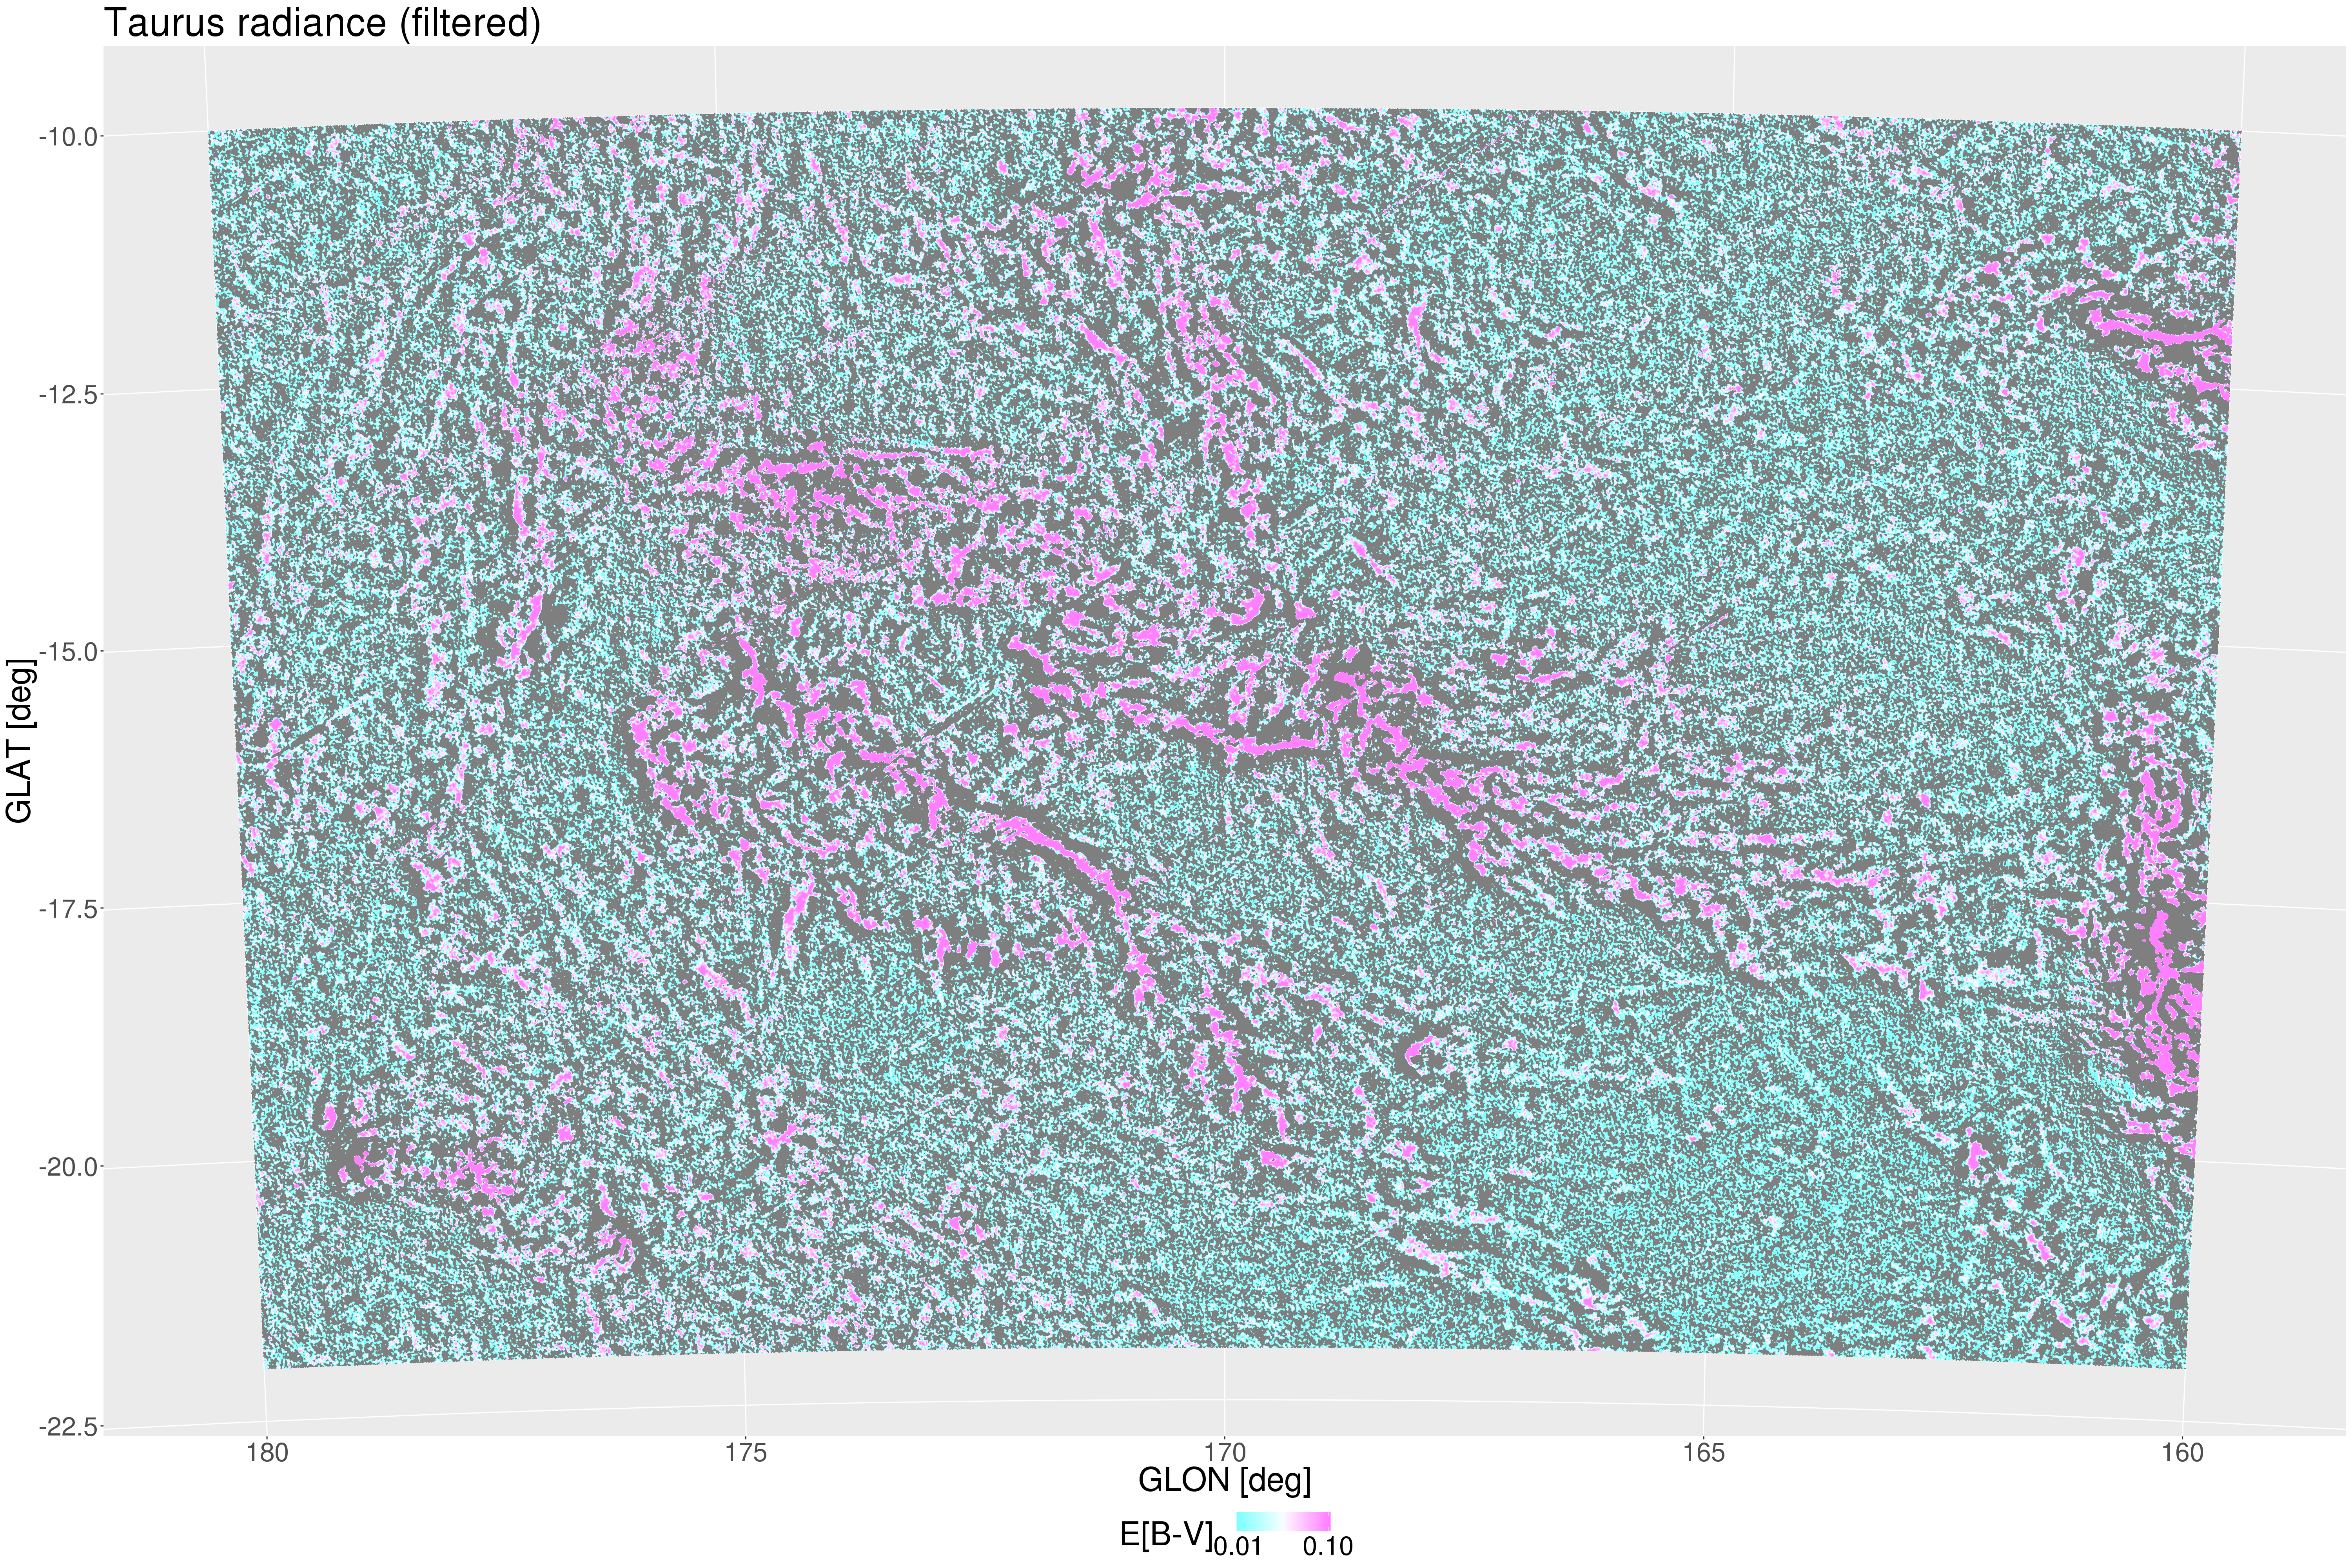
ISM structure identification in Taurus
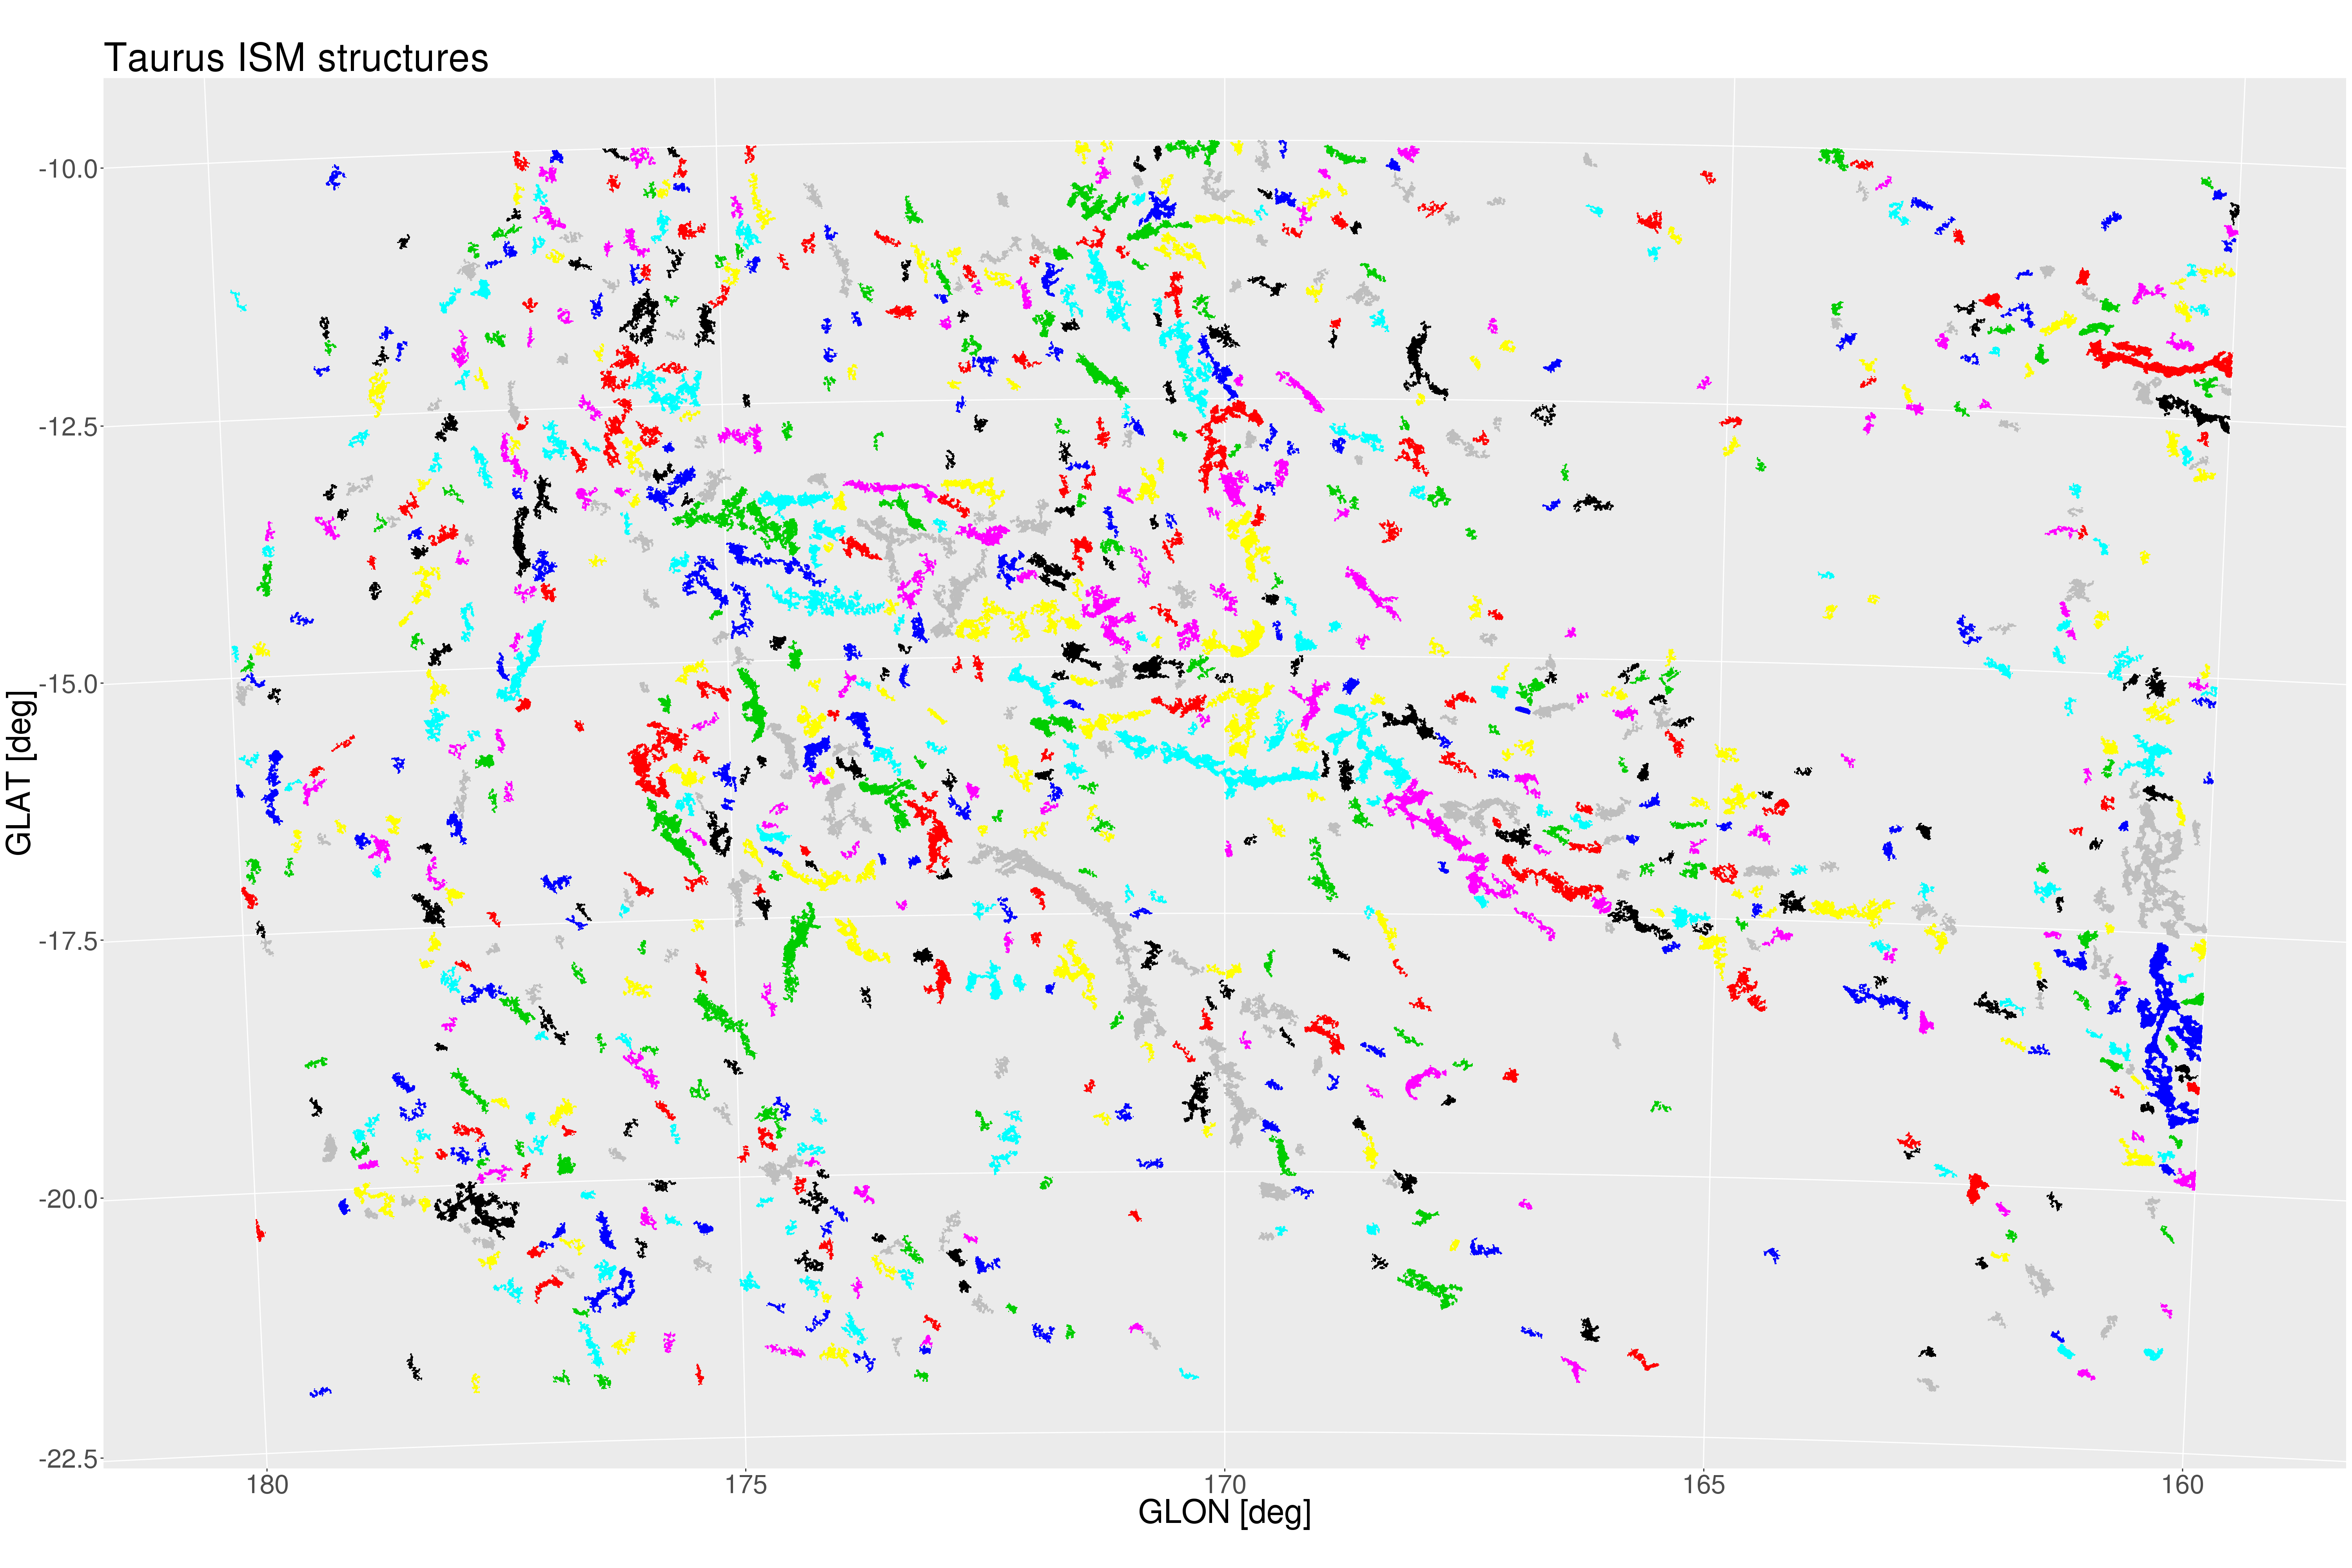
ISM structure identification in Taurus
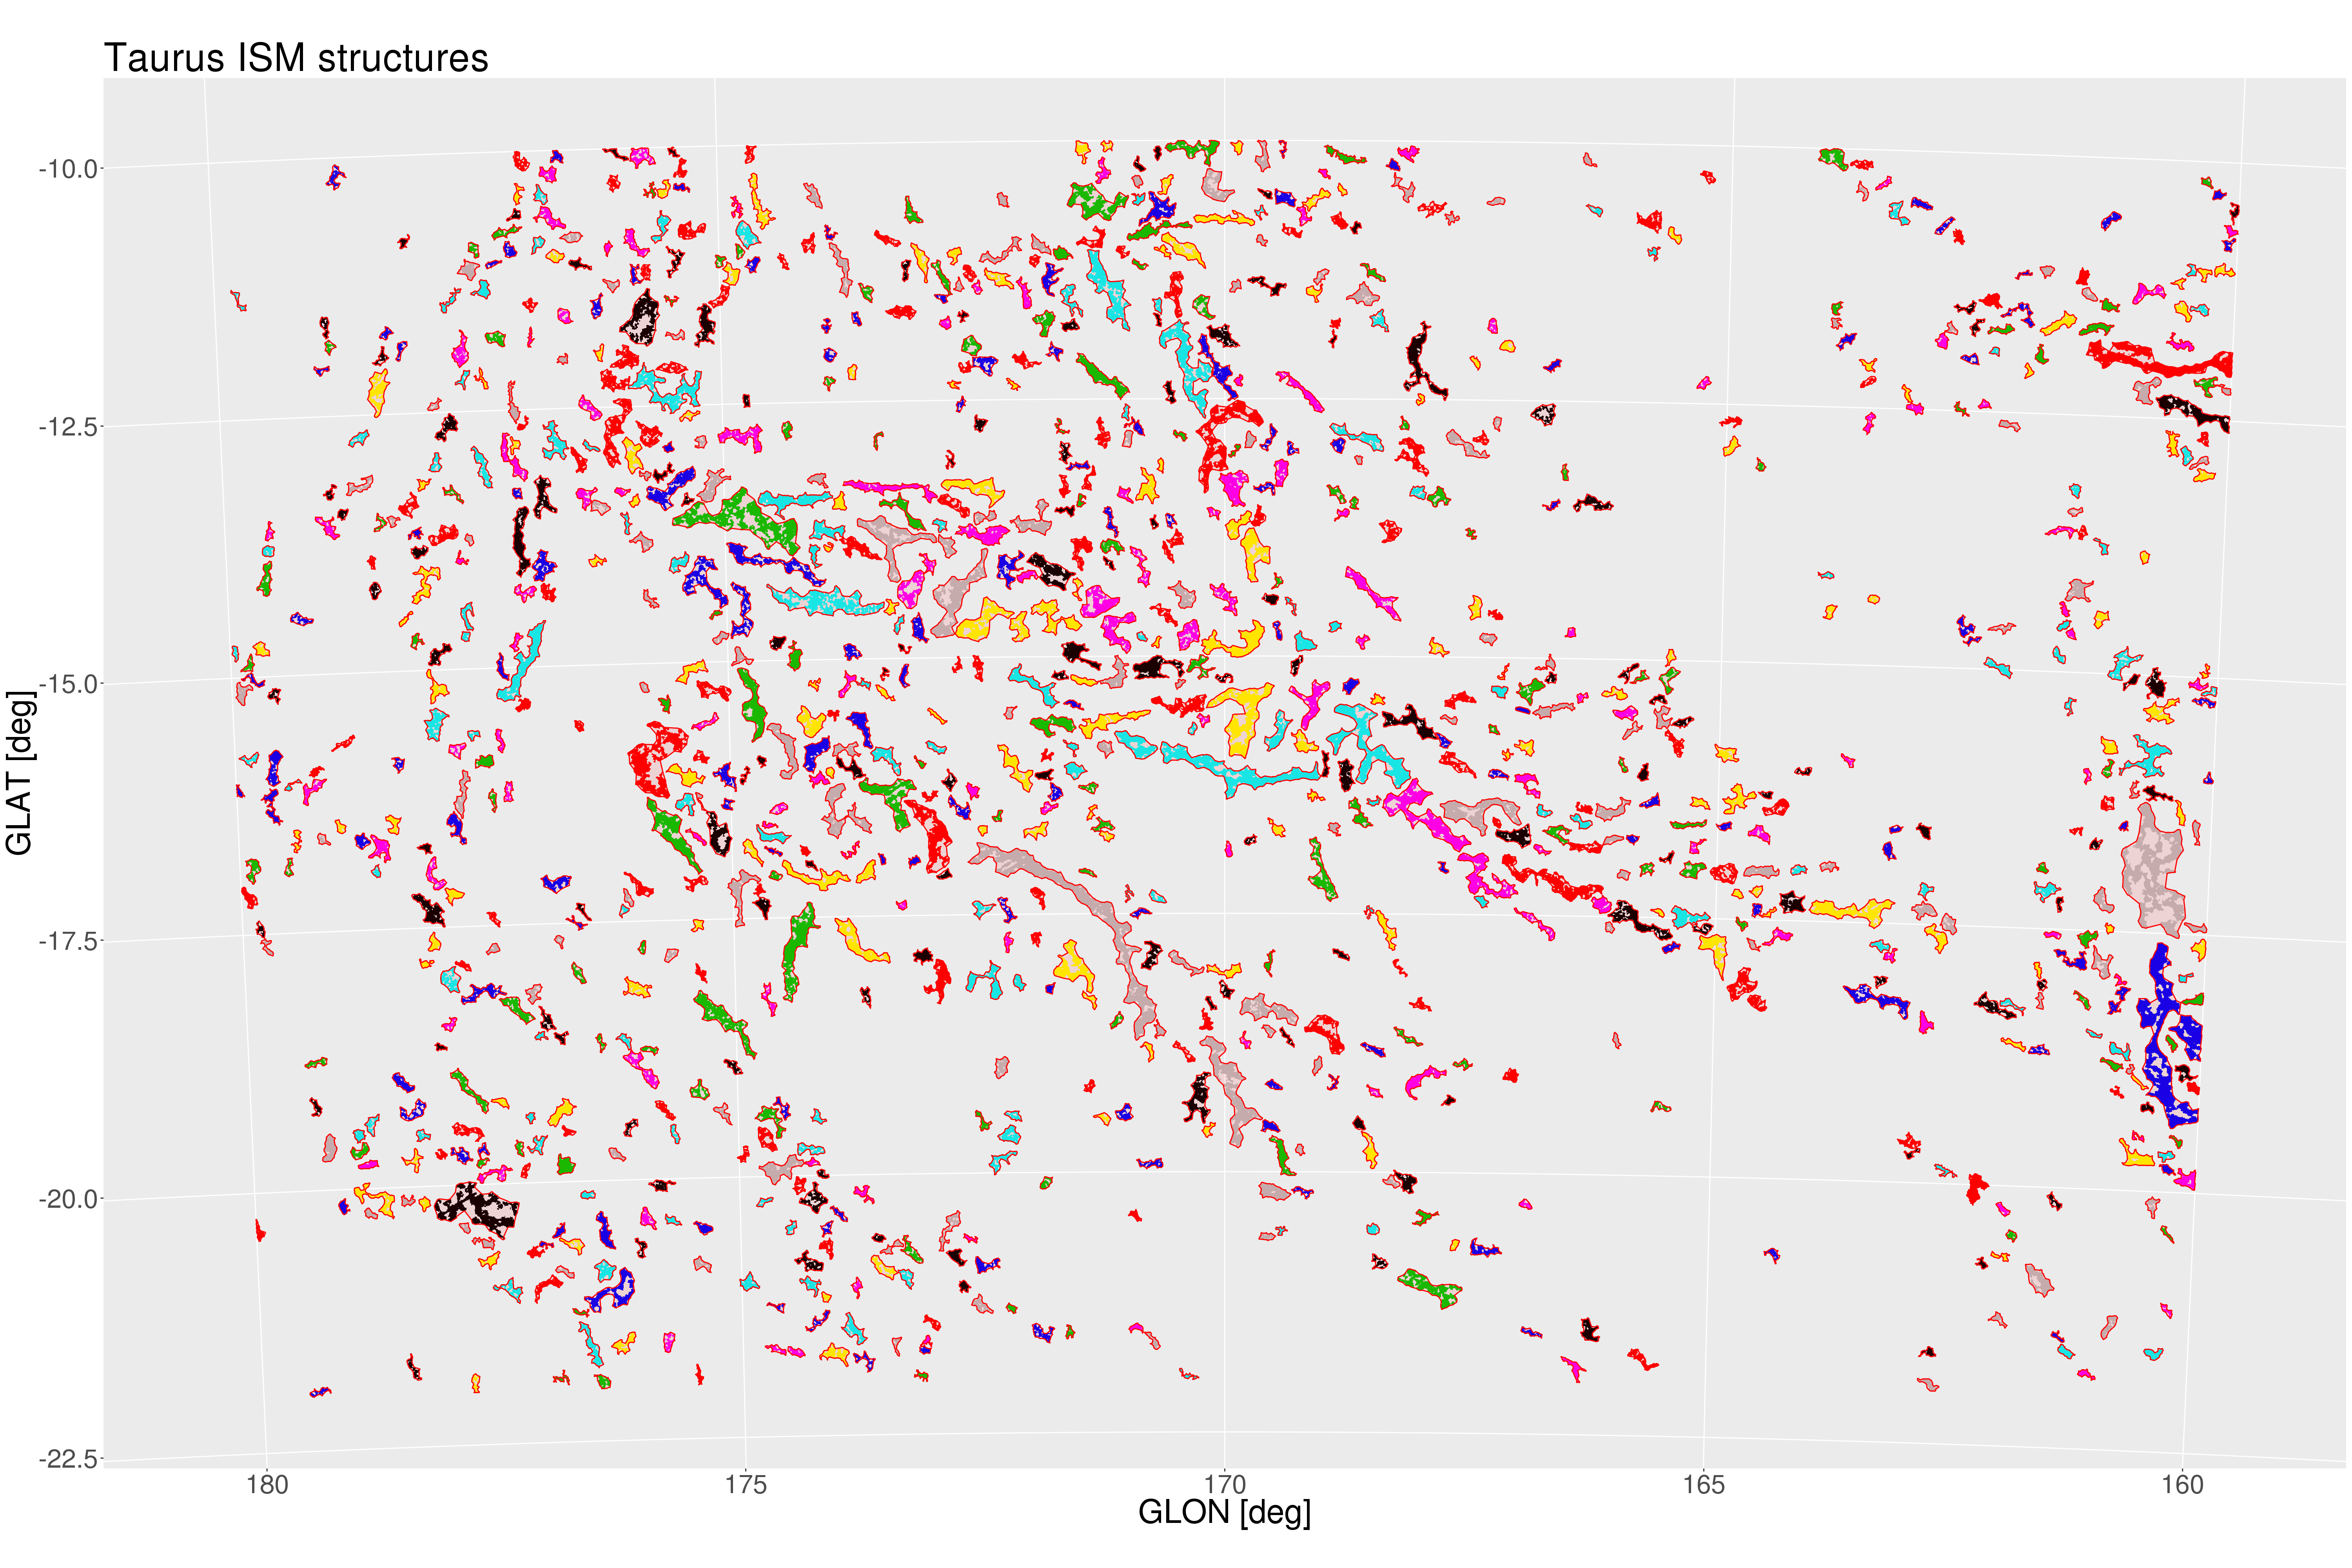
ISM structure identification in Taurus
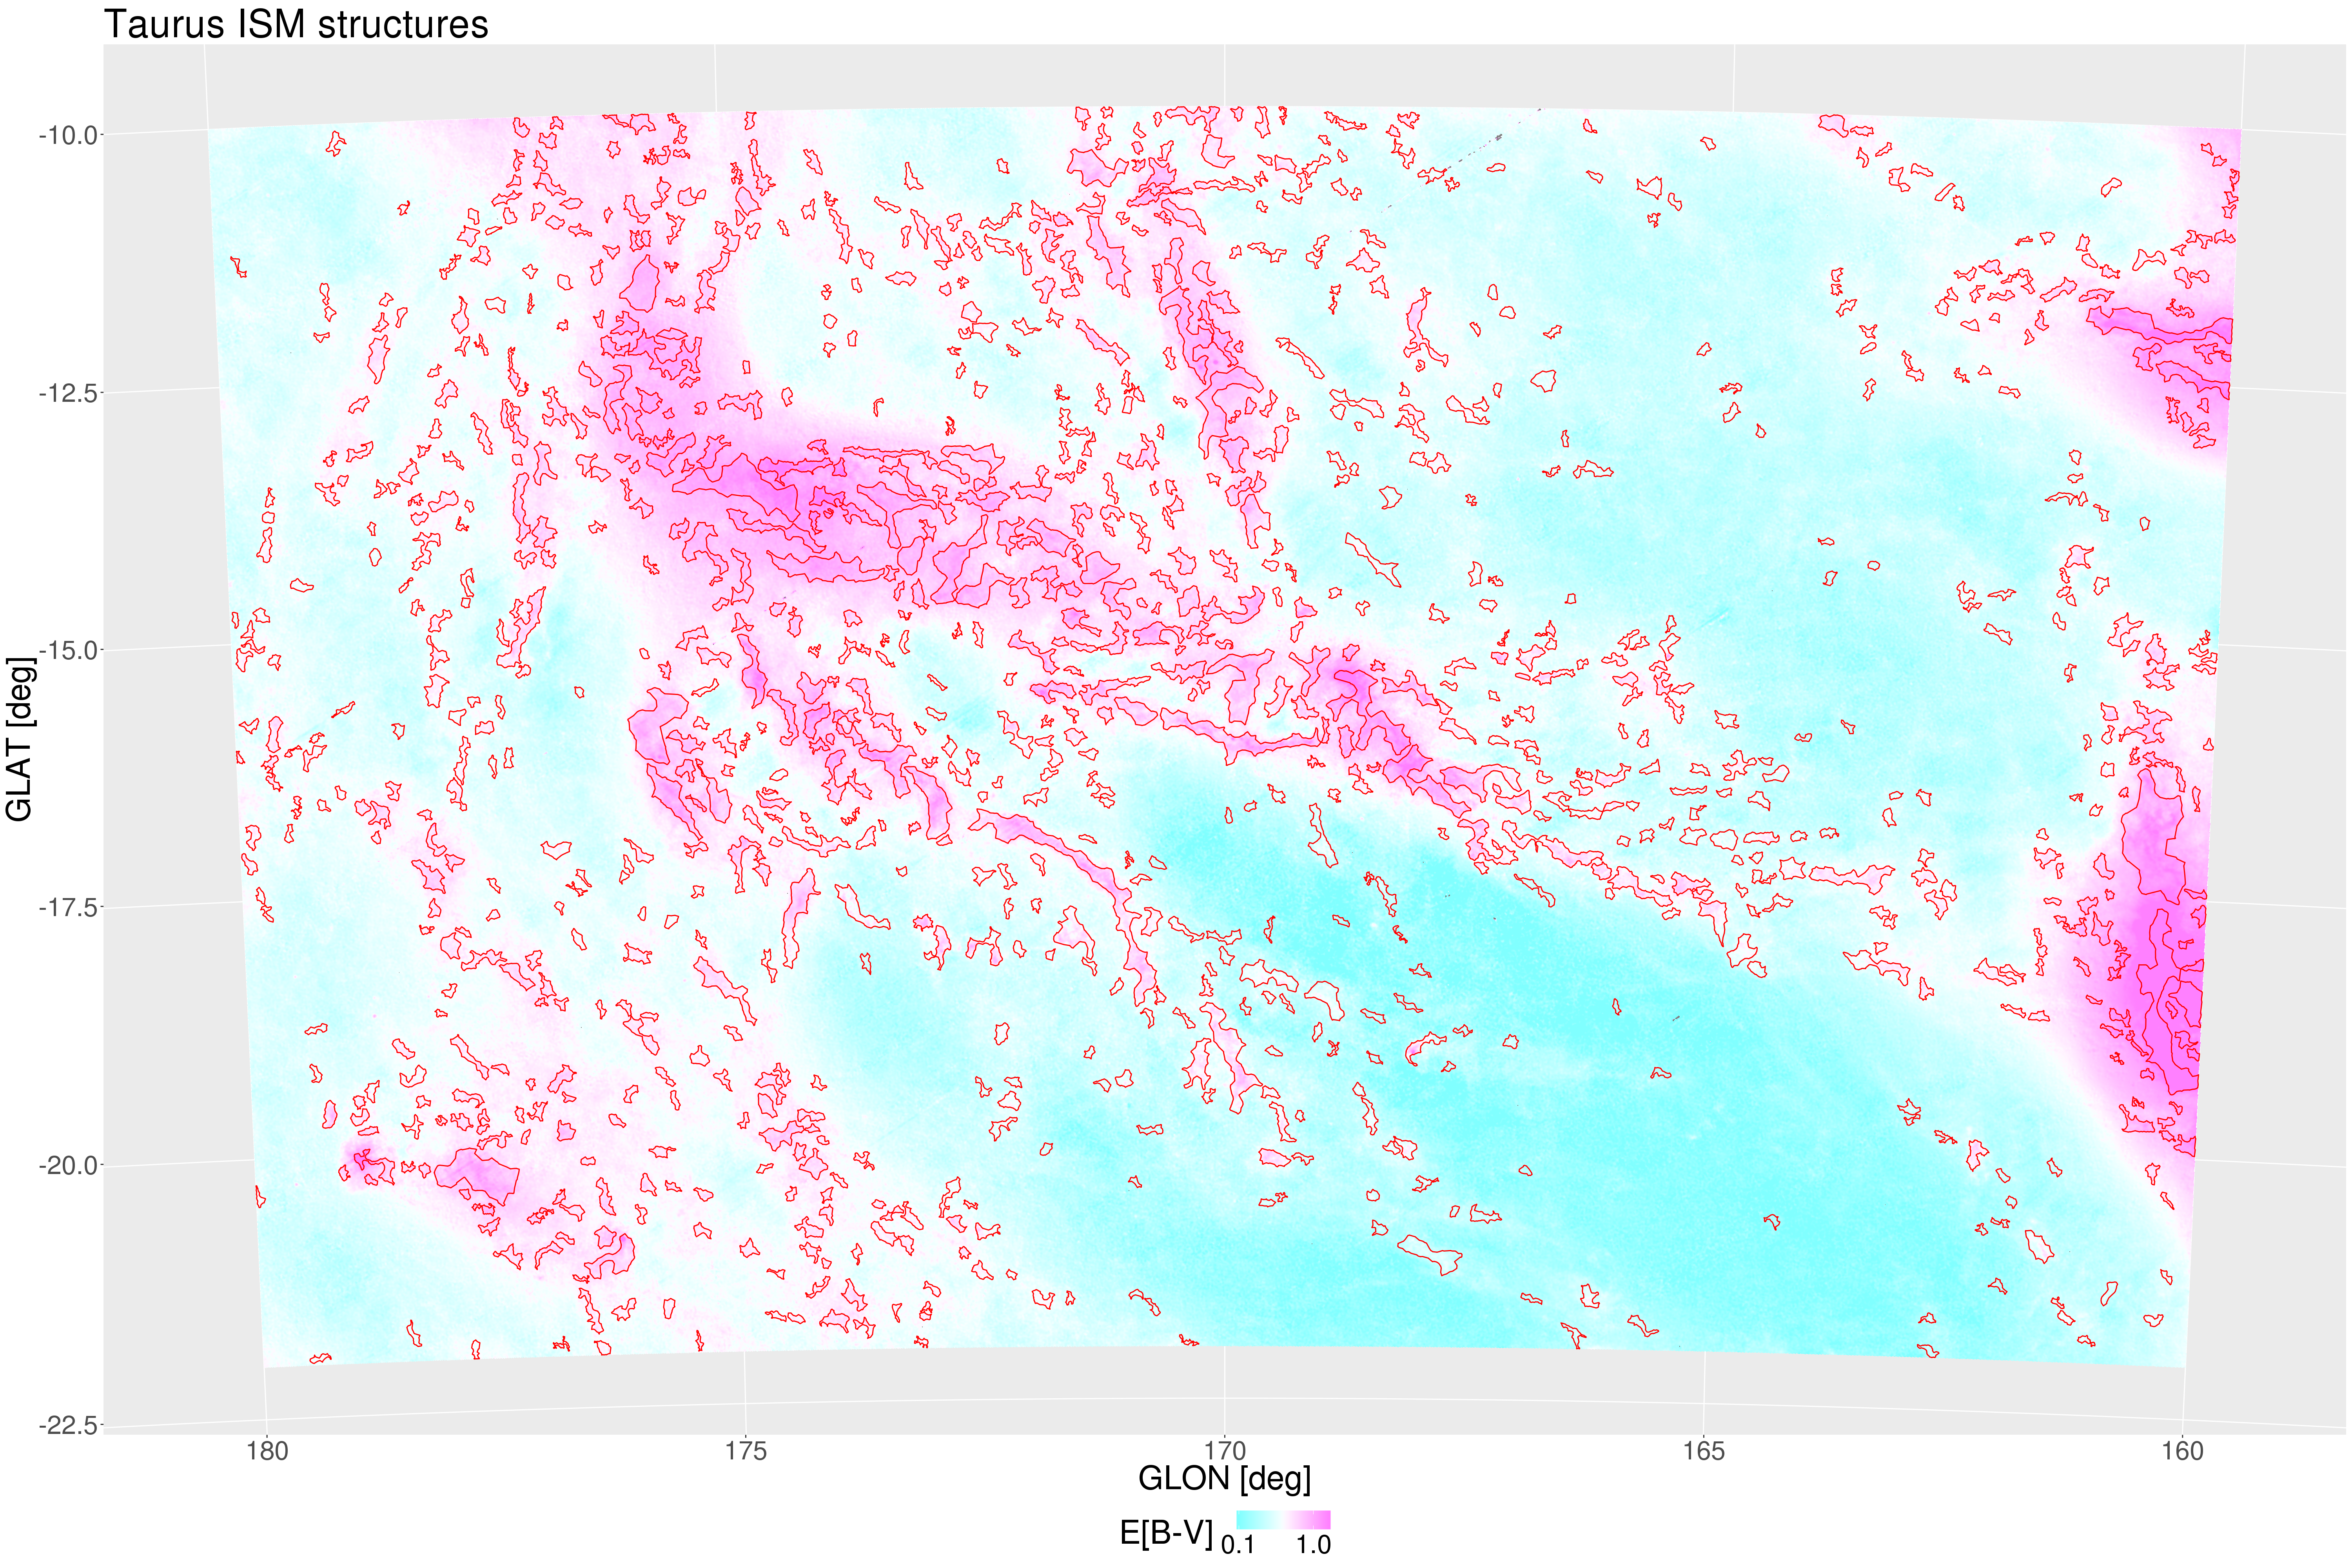
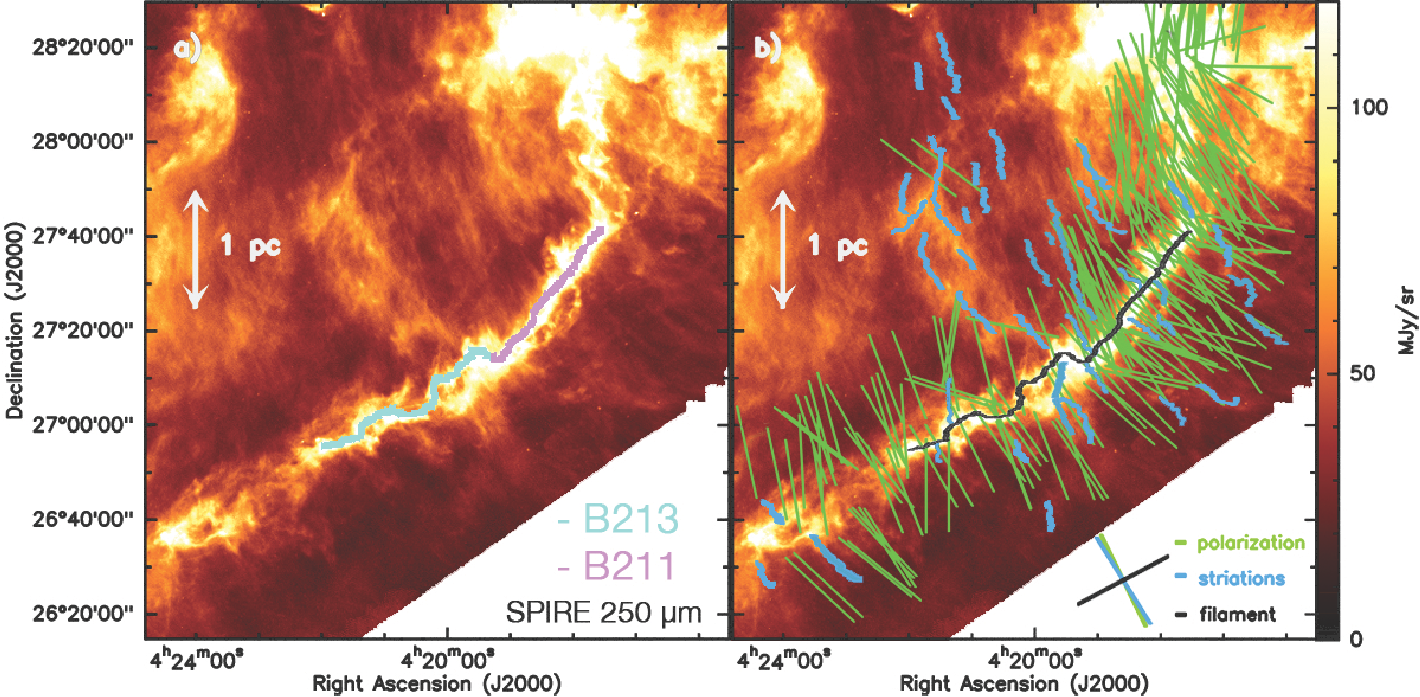
Filaments formation and alignment with B-field
Contraction along B-field
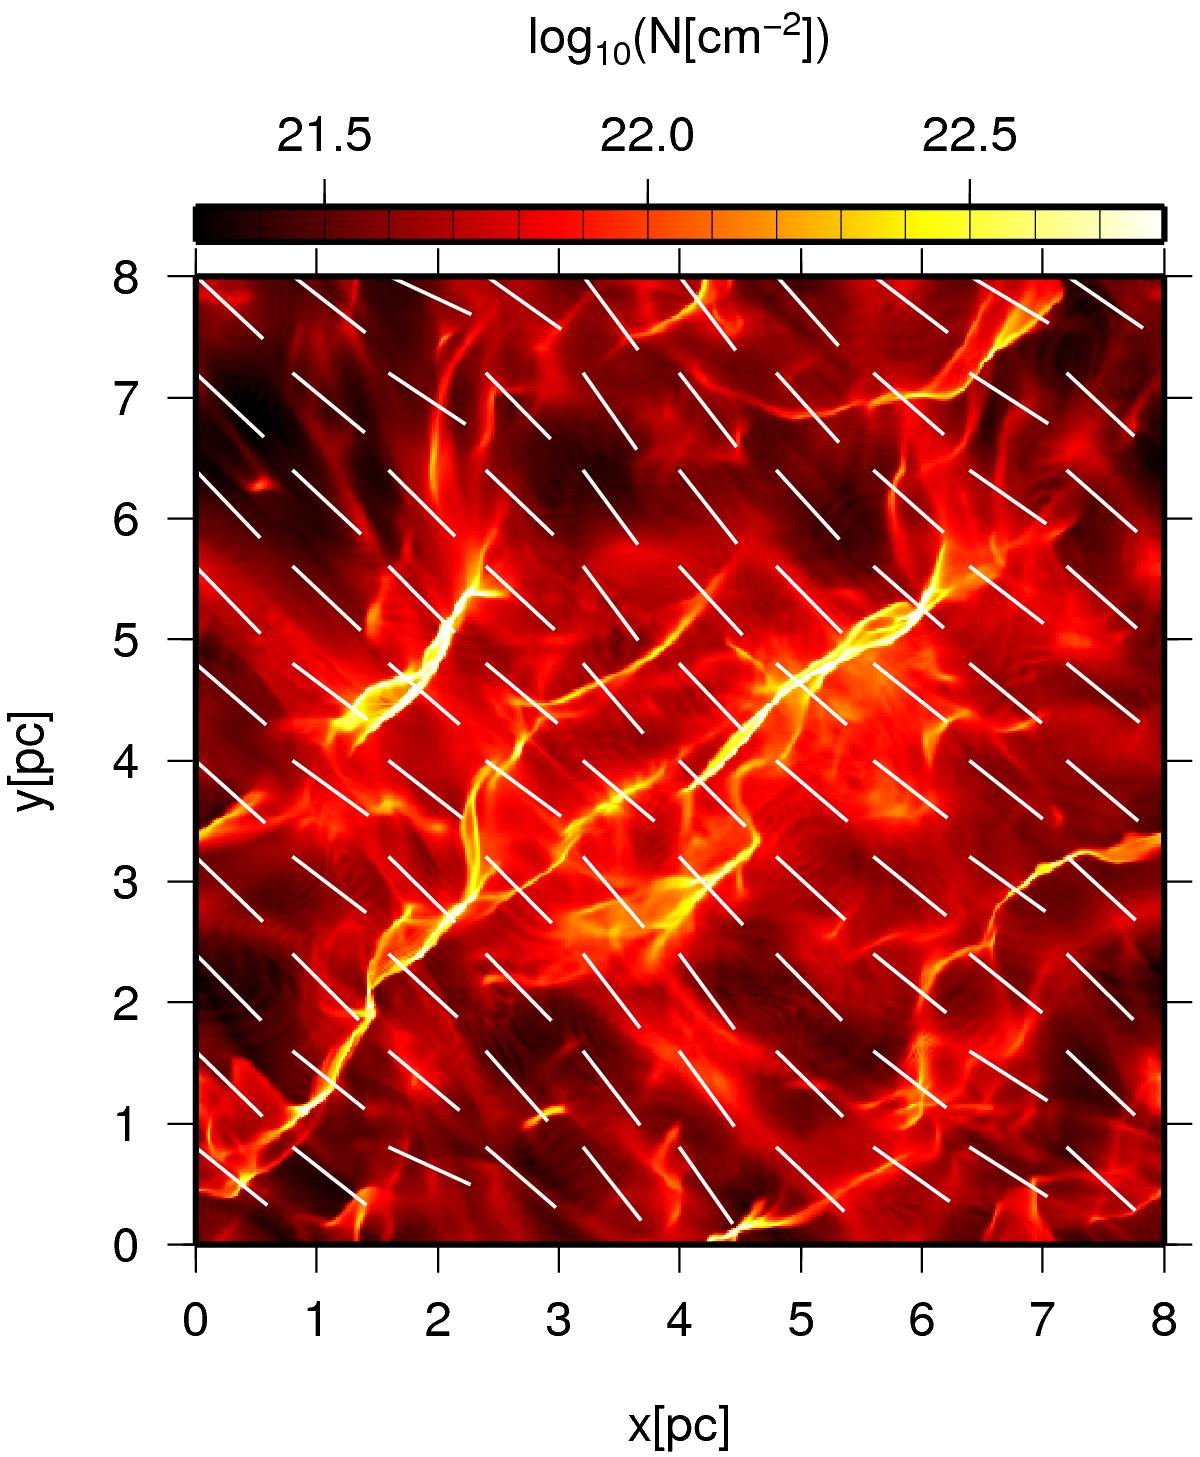
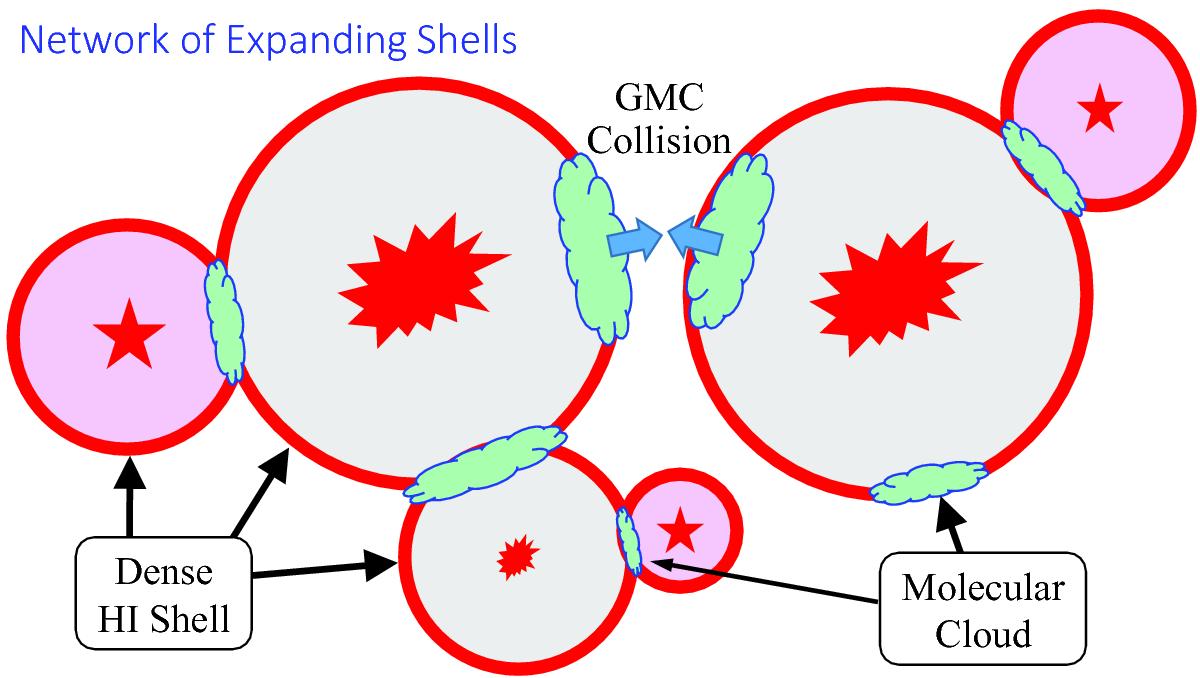
Filaments formation by SN shoks
Filamets alignment with B-field
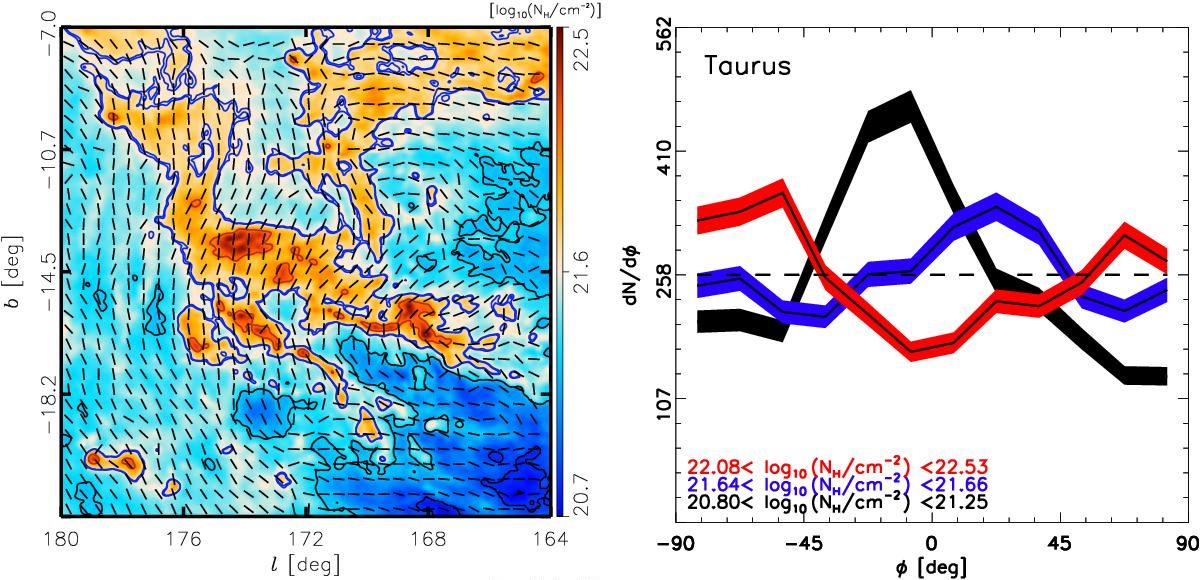
ISM structure vs. Planck B-field
ISM structure vs. Planck B-field
<! --  -->
-->
ISM structure vs. Planck B-field
AKARI 
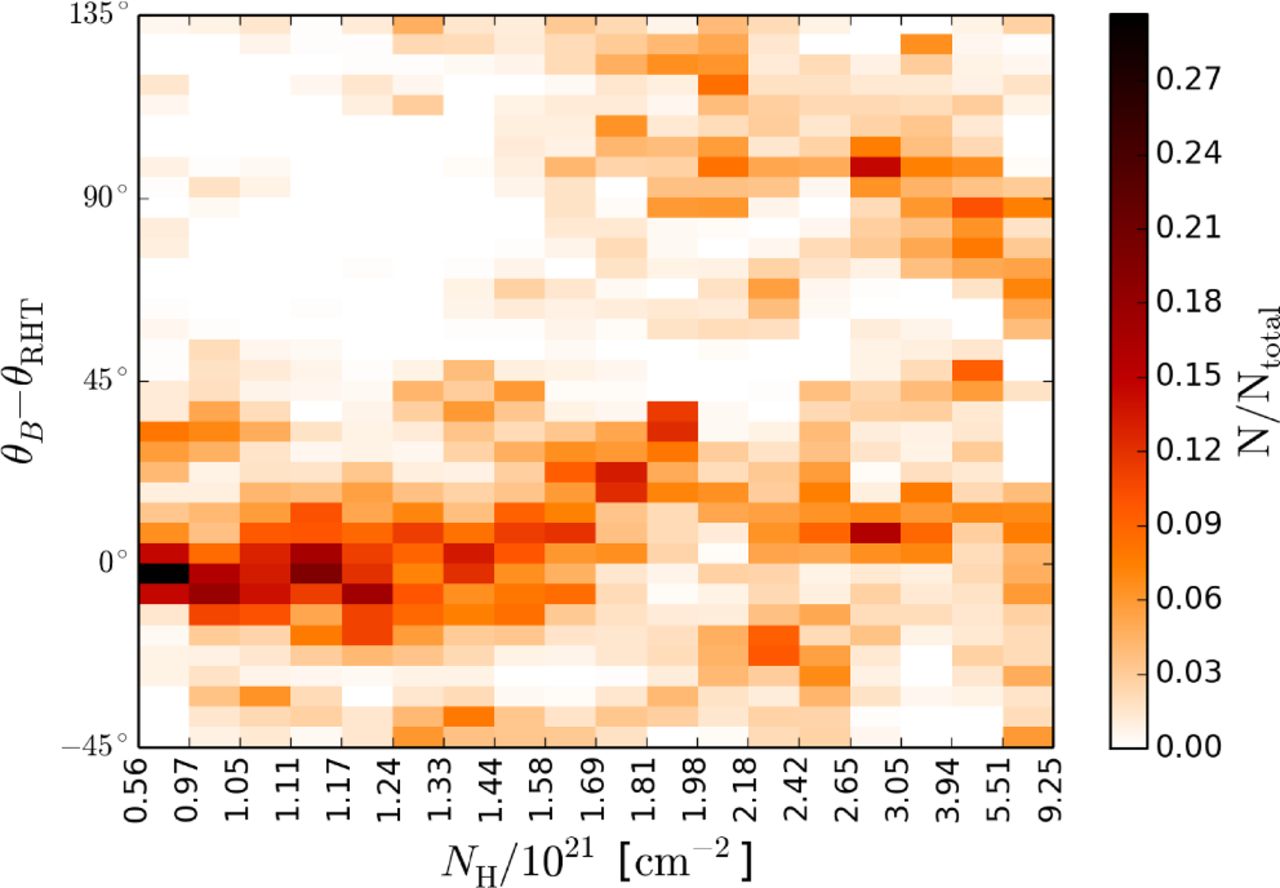
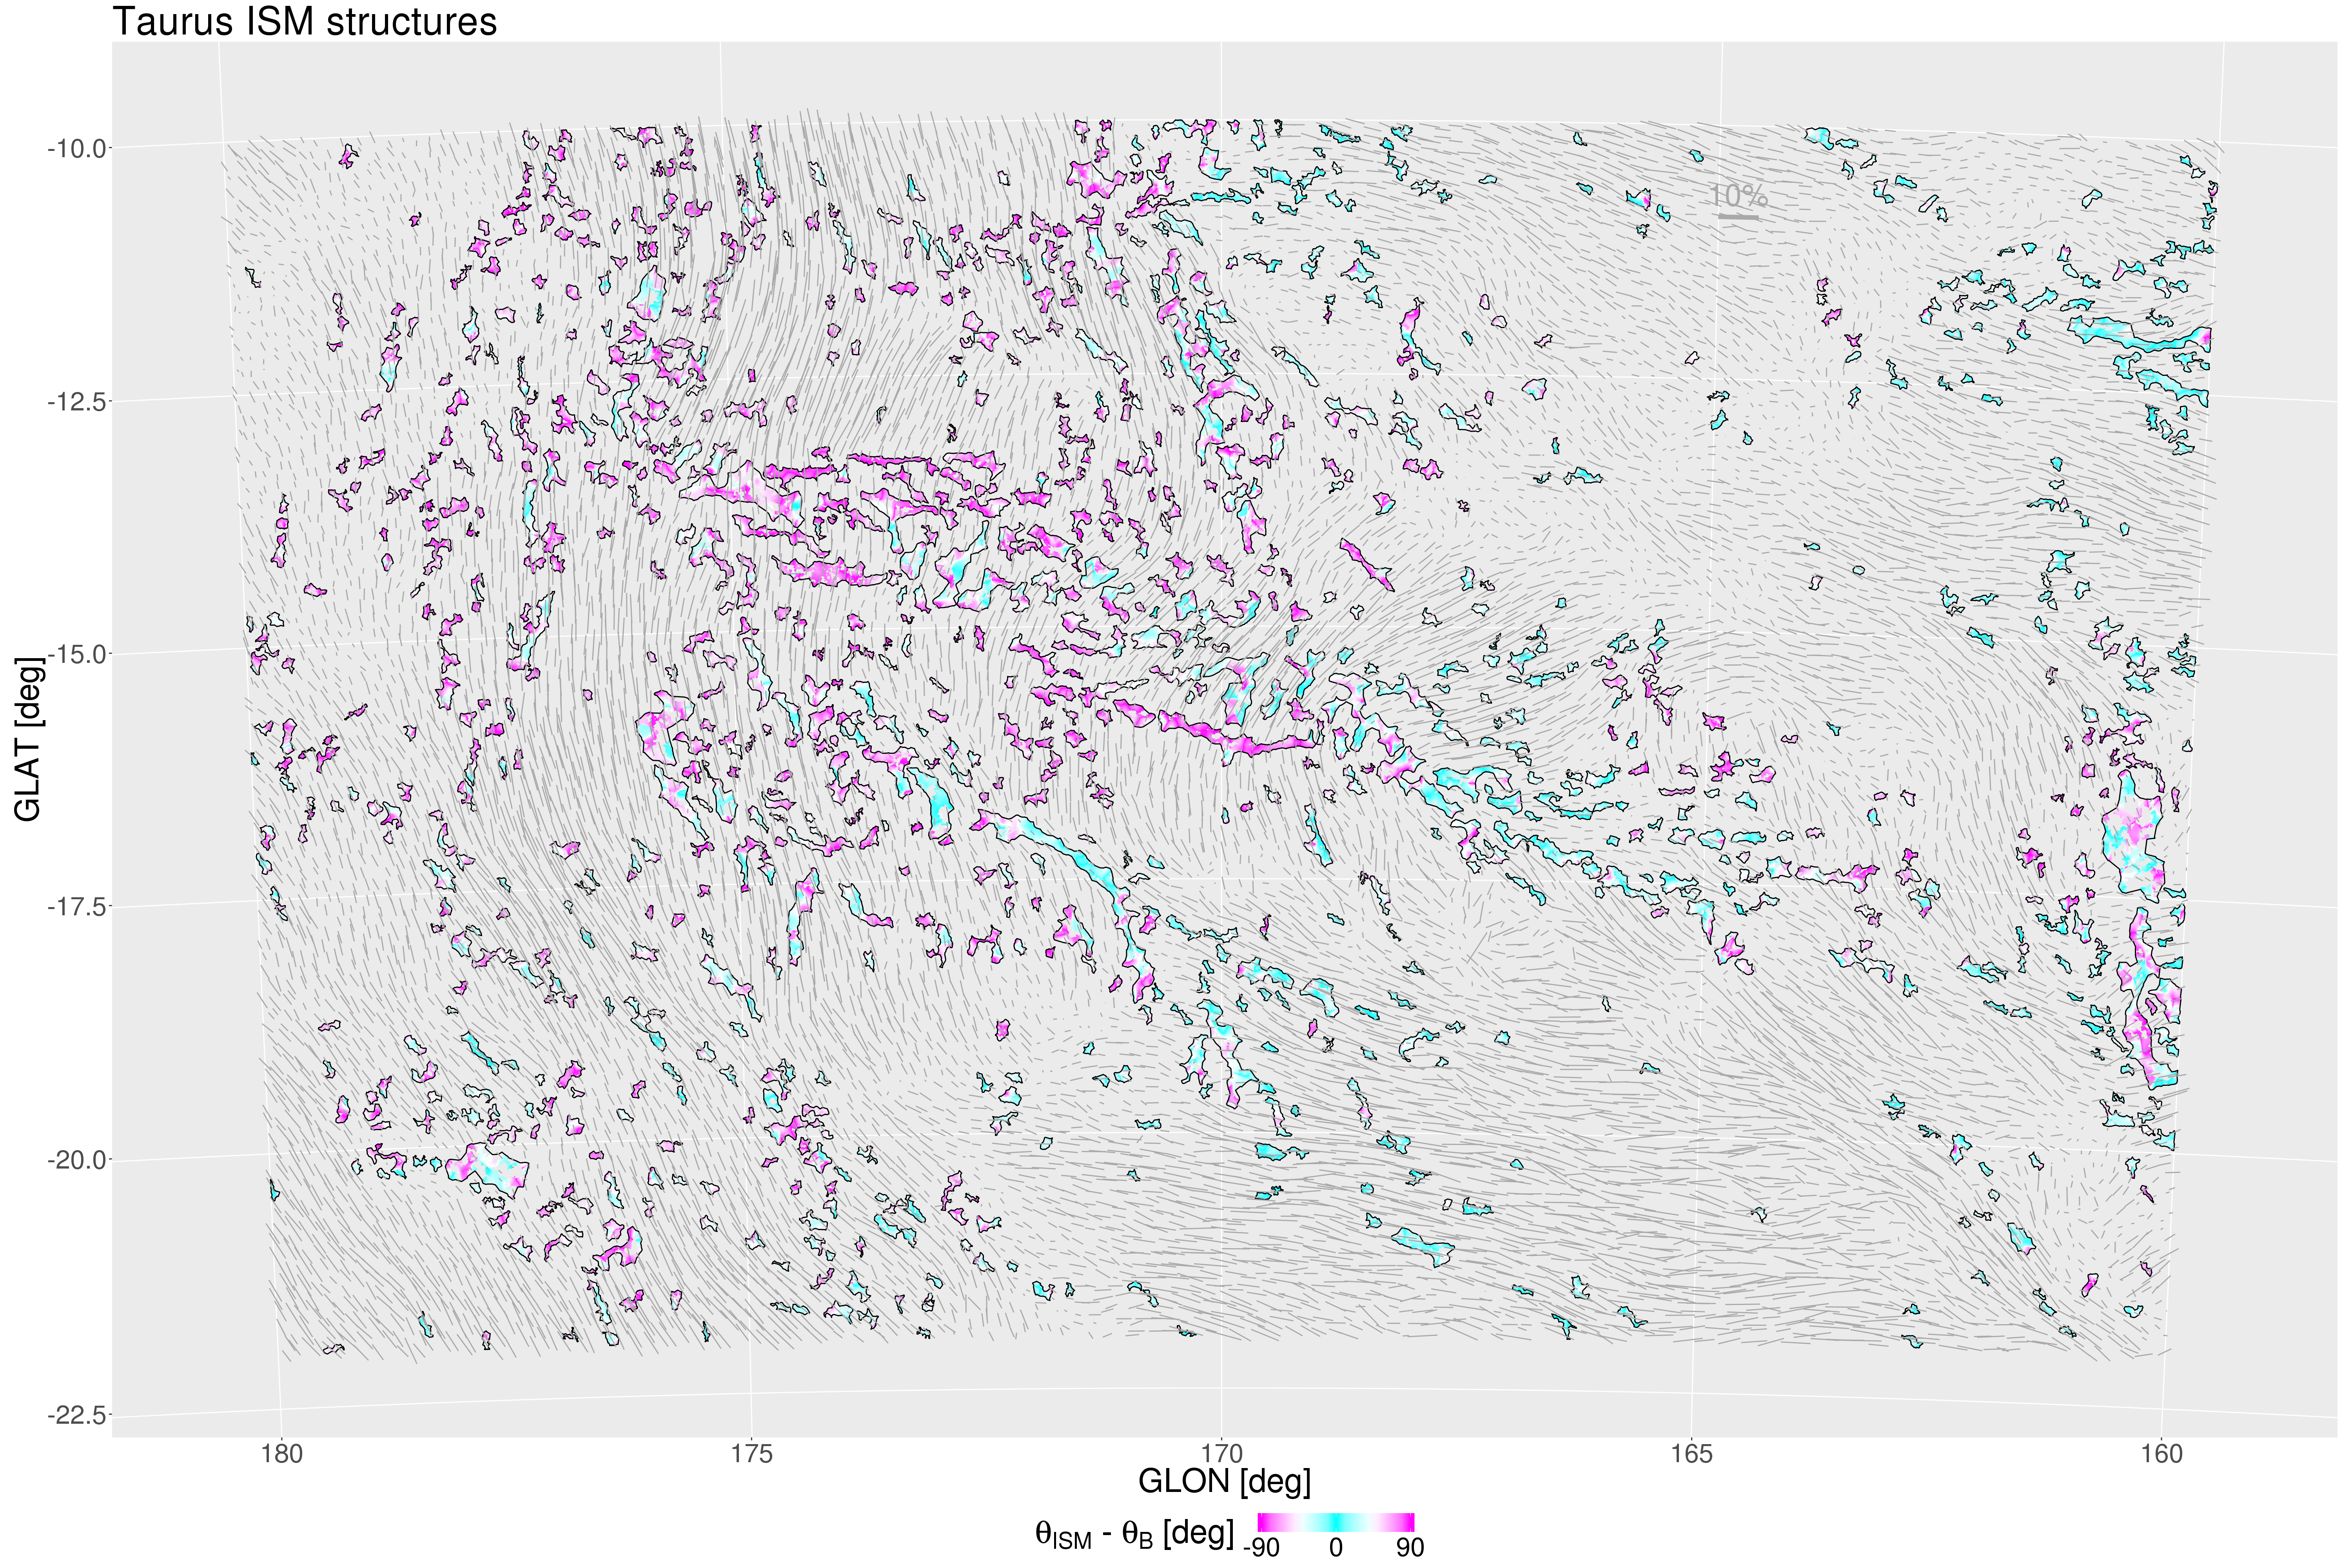
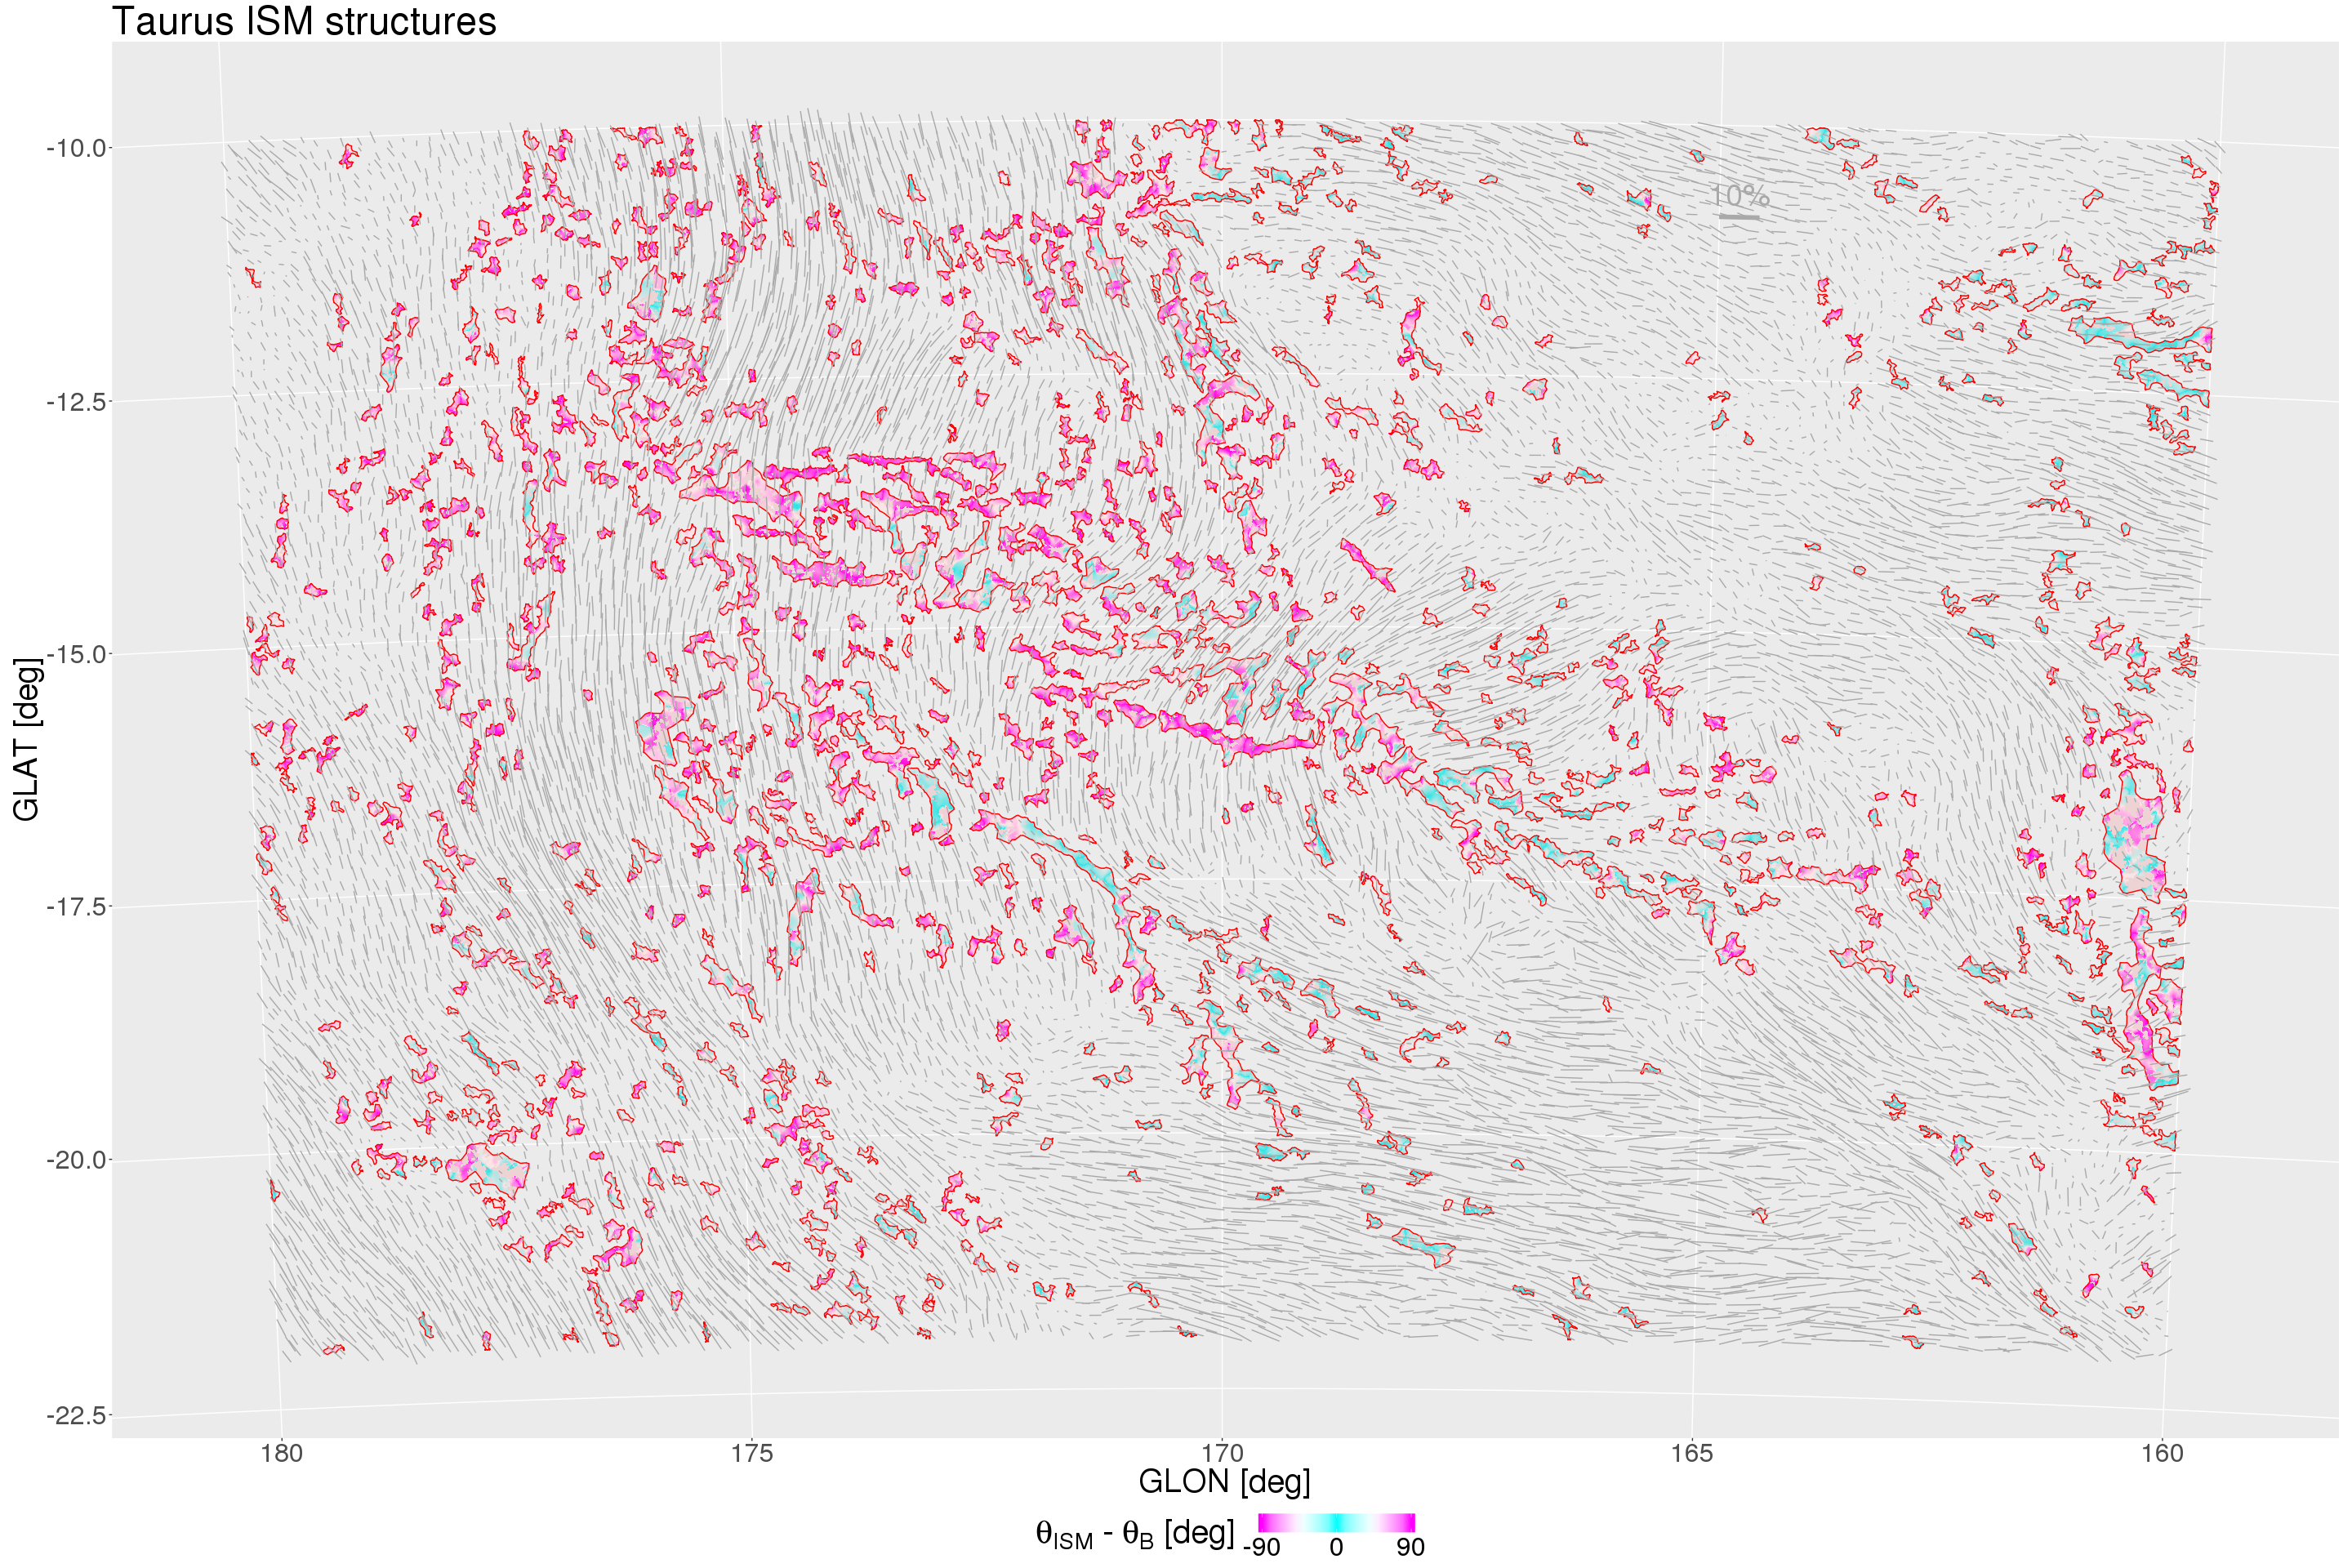
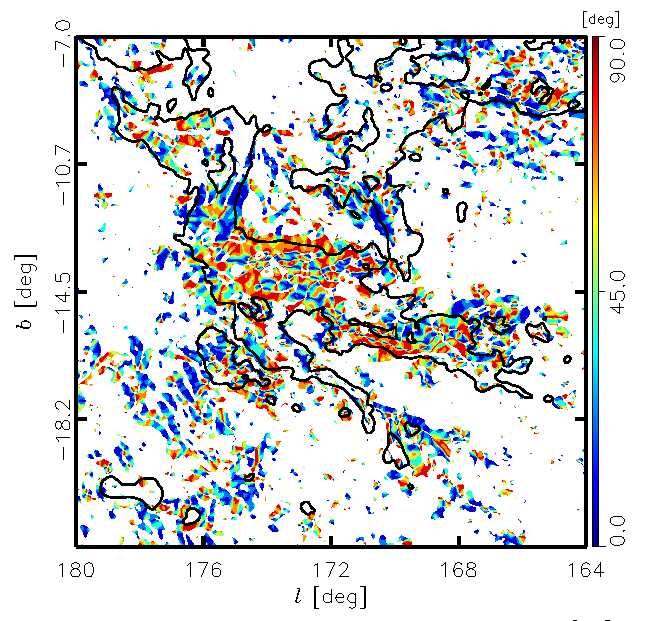
Relative angle of \(\theta_{\rm ISM}\) and \(\theta_{\rm B}\)
AKARI Taurus
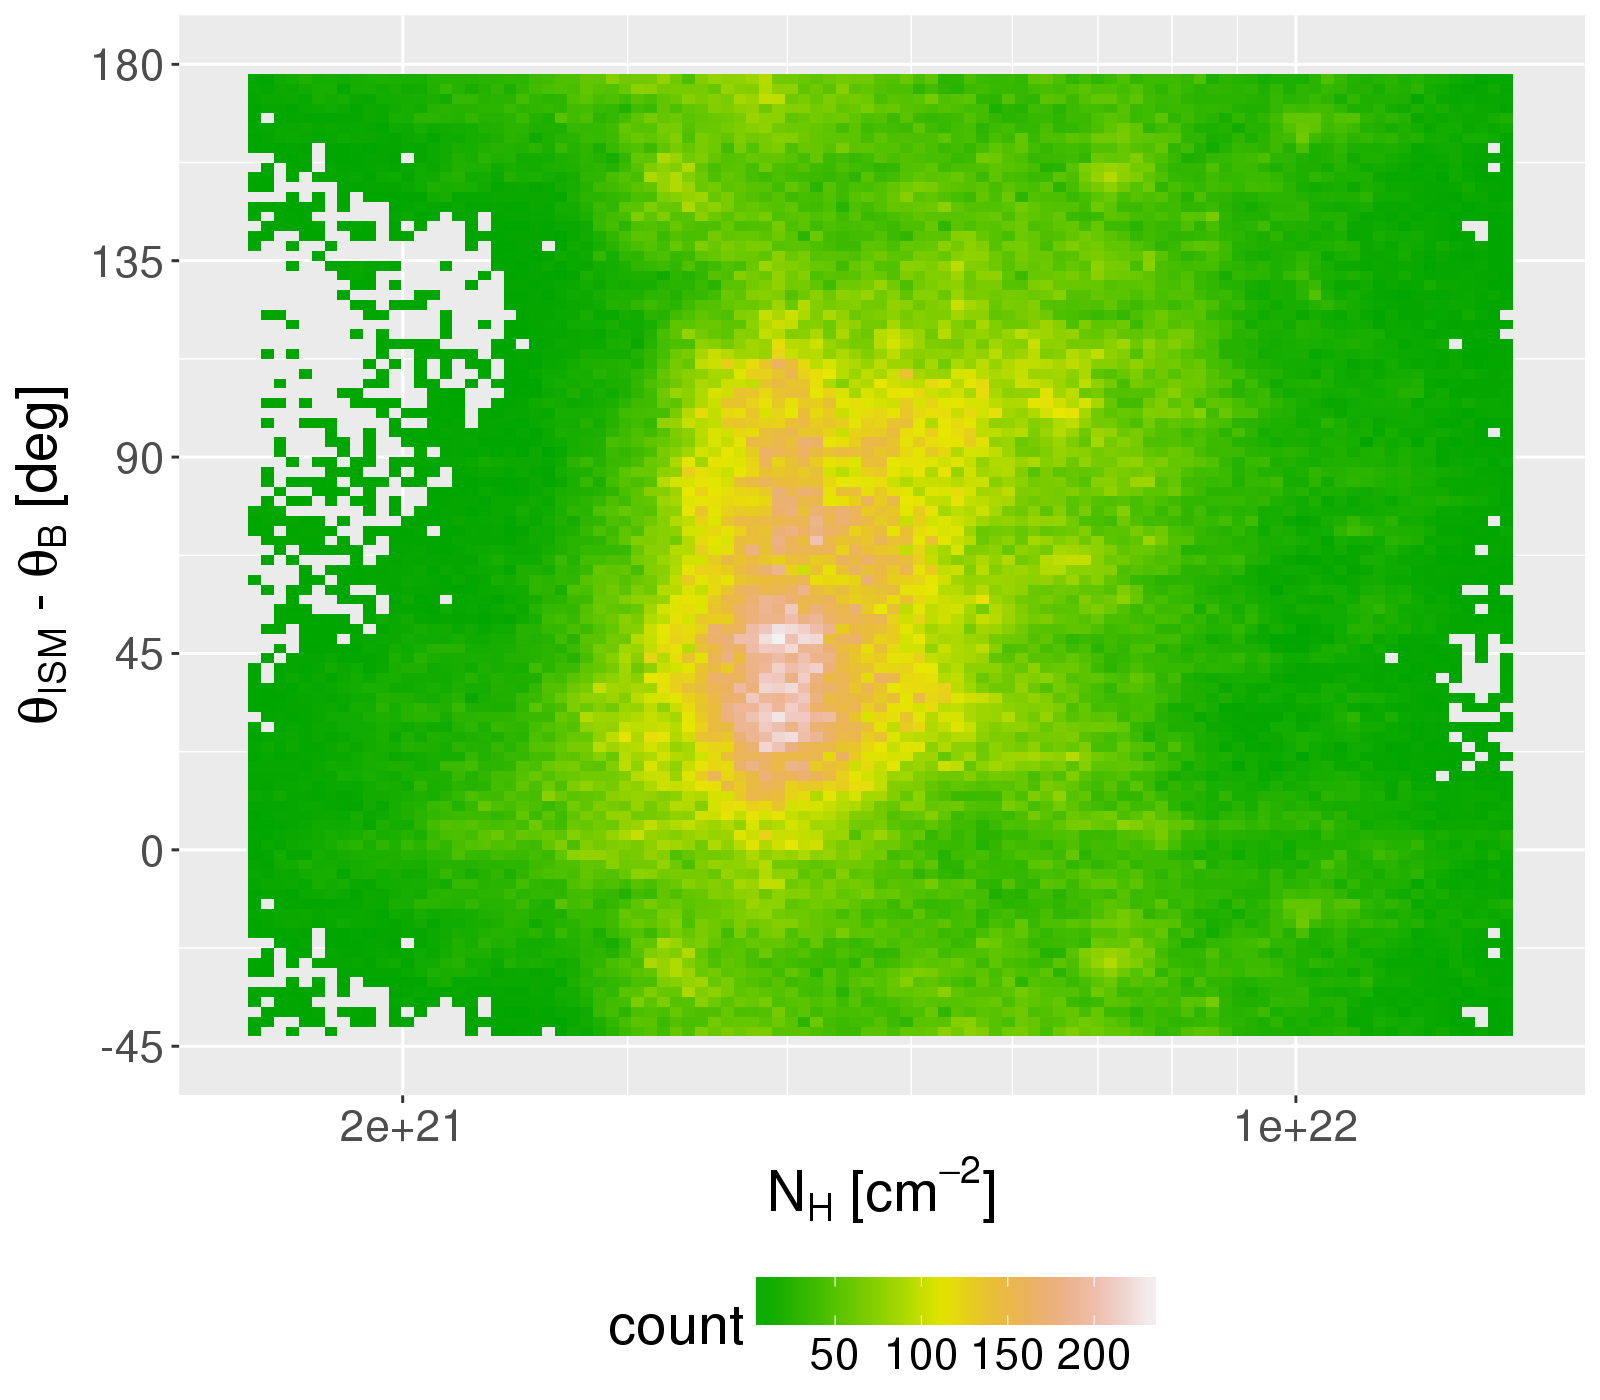
Relative angle of \(\theta_{\rm ISM}\) and \(\theta_{\rm B}\)
- High-density ISM structure \(\perp\) B-field
- Low-density ISM structure \(\parallel\) B-field
- Bimodality is not as clear as seen by Planck
- Higher spatial resolution required for B-field
Relative angle of \(\theta_{\rm ISM}\) and \(\theta_{\rm B}\)
- High-density ISM structure \(\perp\) B-field
- Low-density ISM structure \(\parallel\) B-field
- Bimodality is not as clear as seen by Planck
- Higher spatial resolution required for B-field
 We need SPICA!
YSO distribution
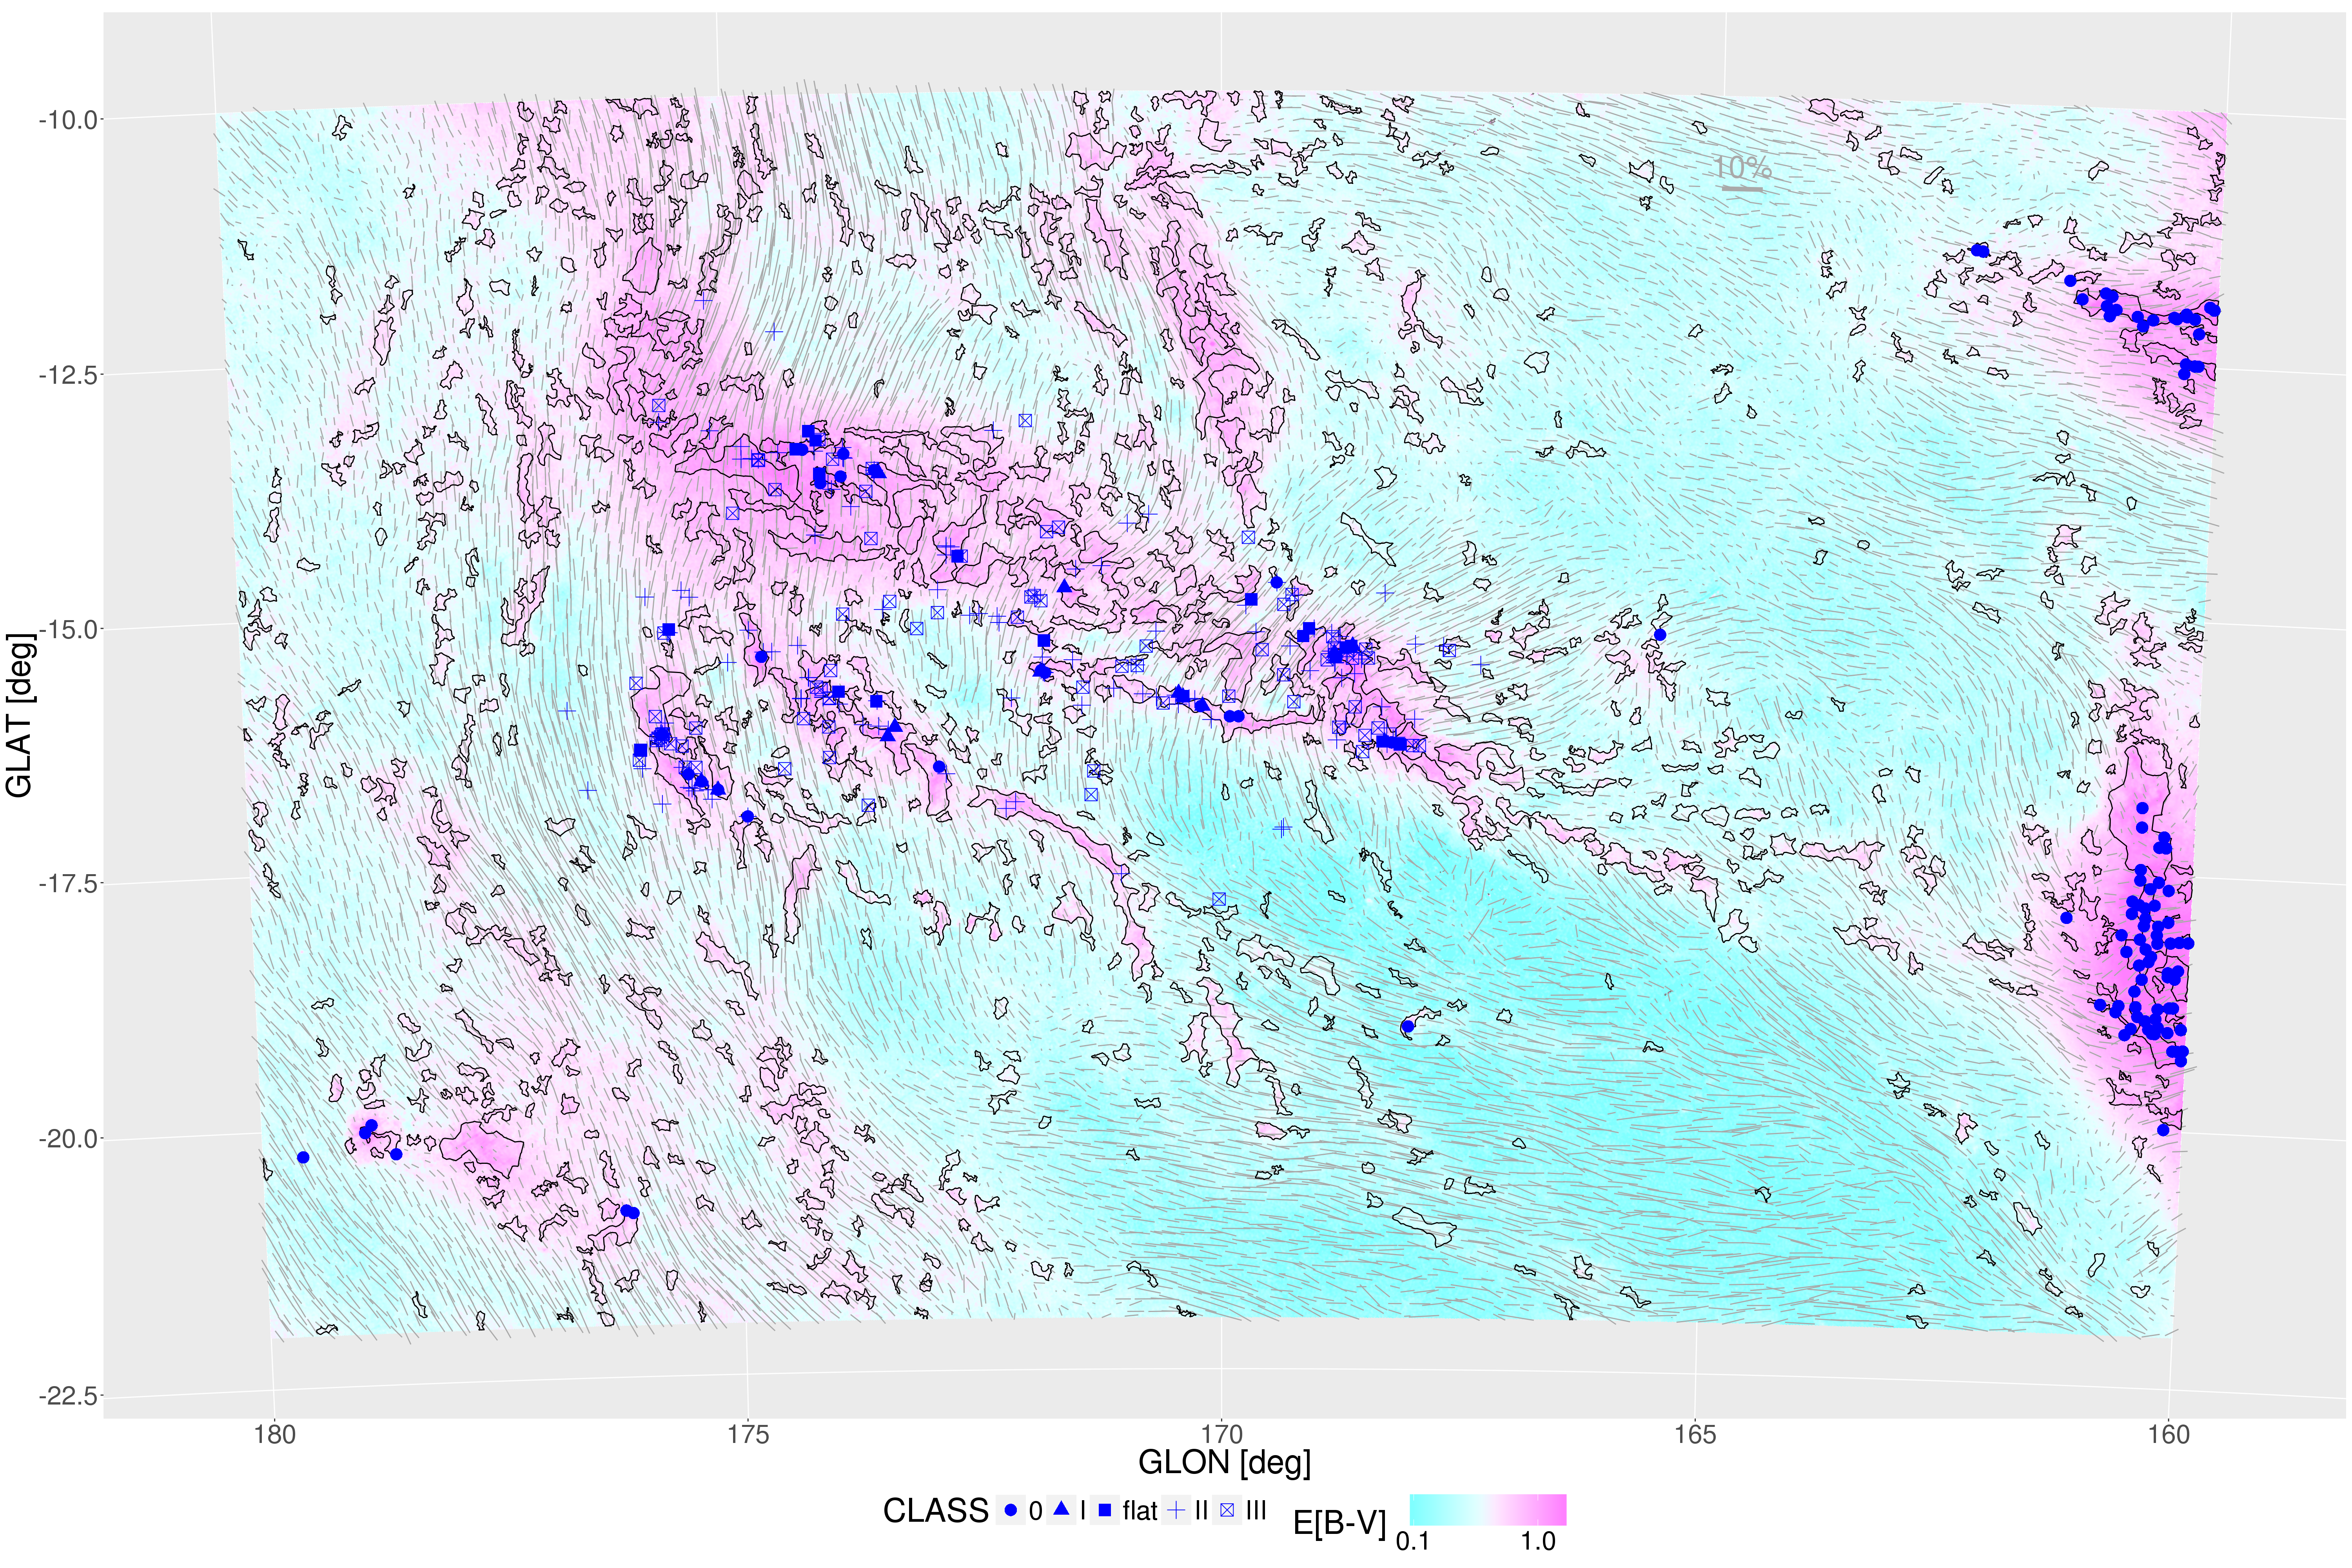
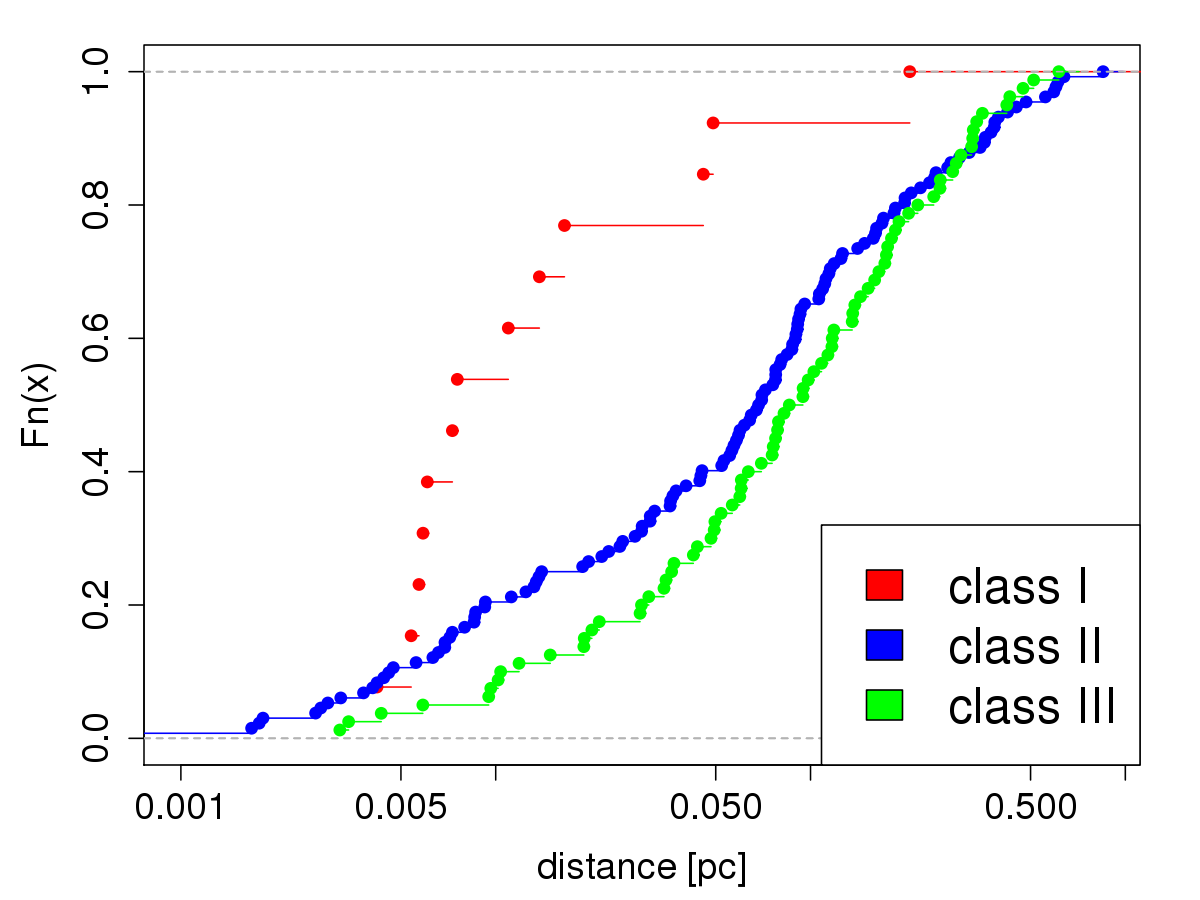
YSO distance from adjacent ISM peaks
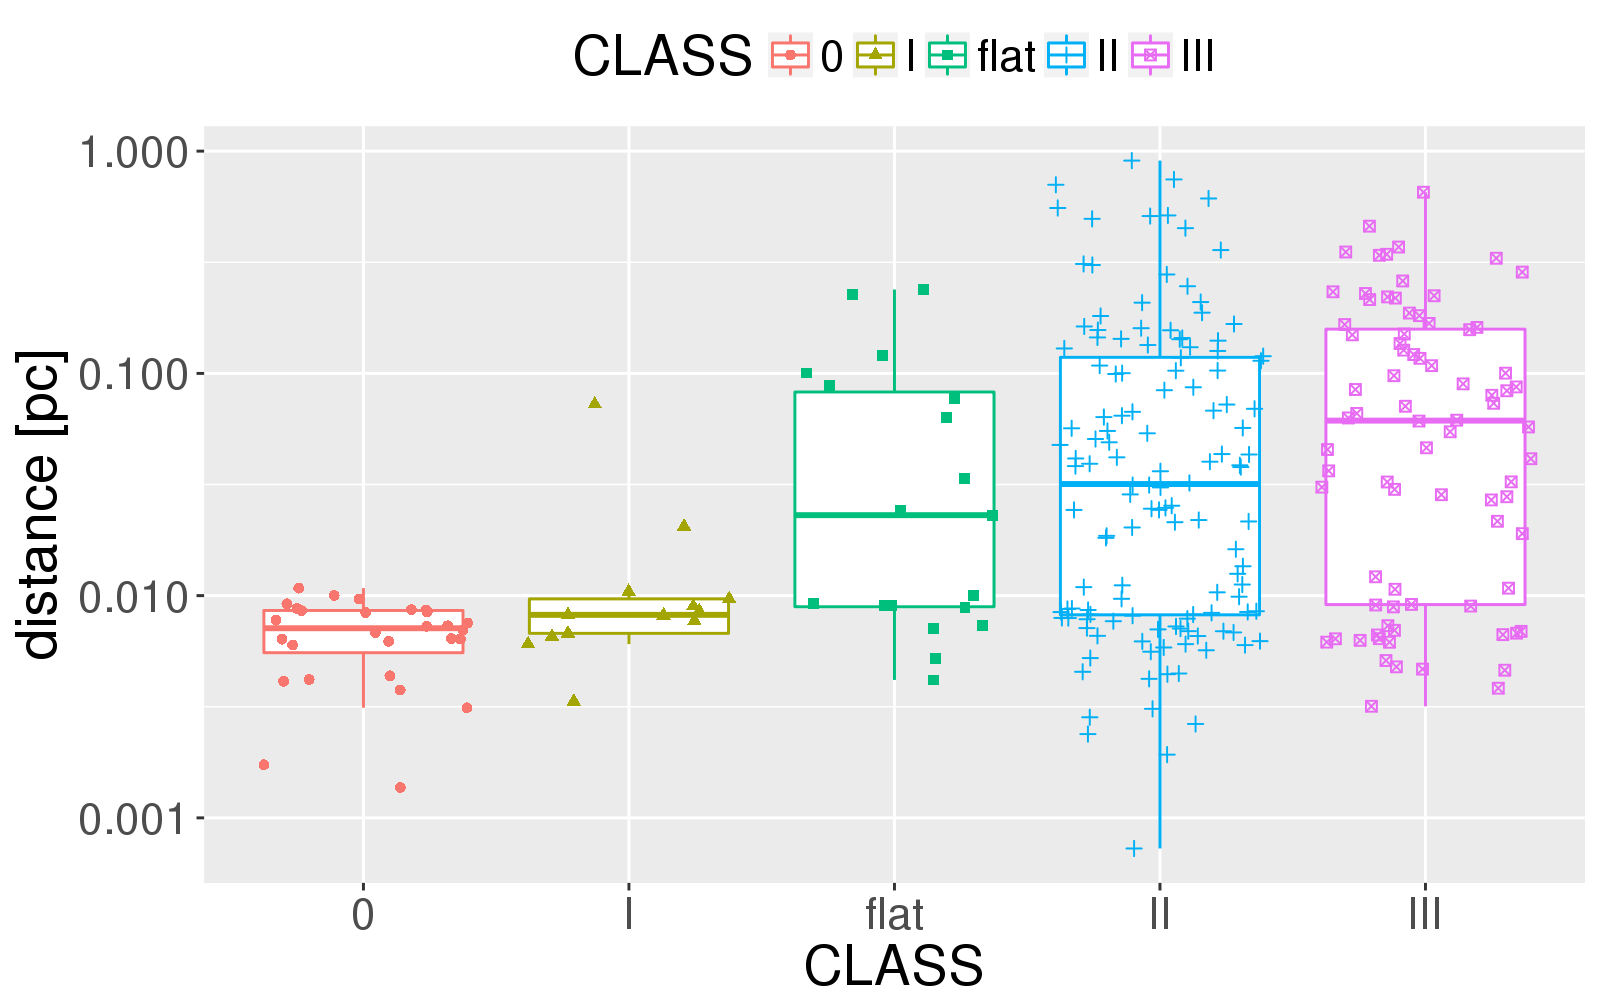
YSO distance from adjacent ISM peaks
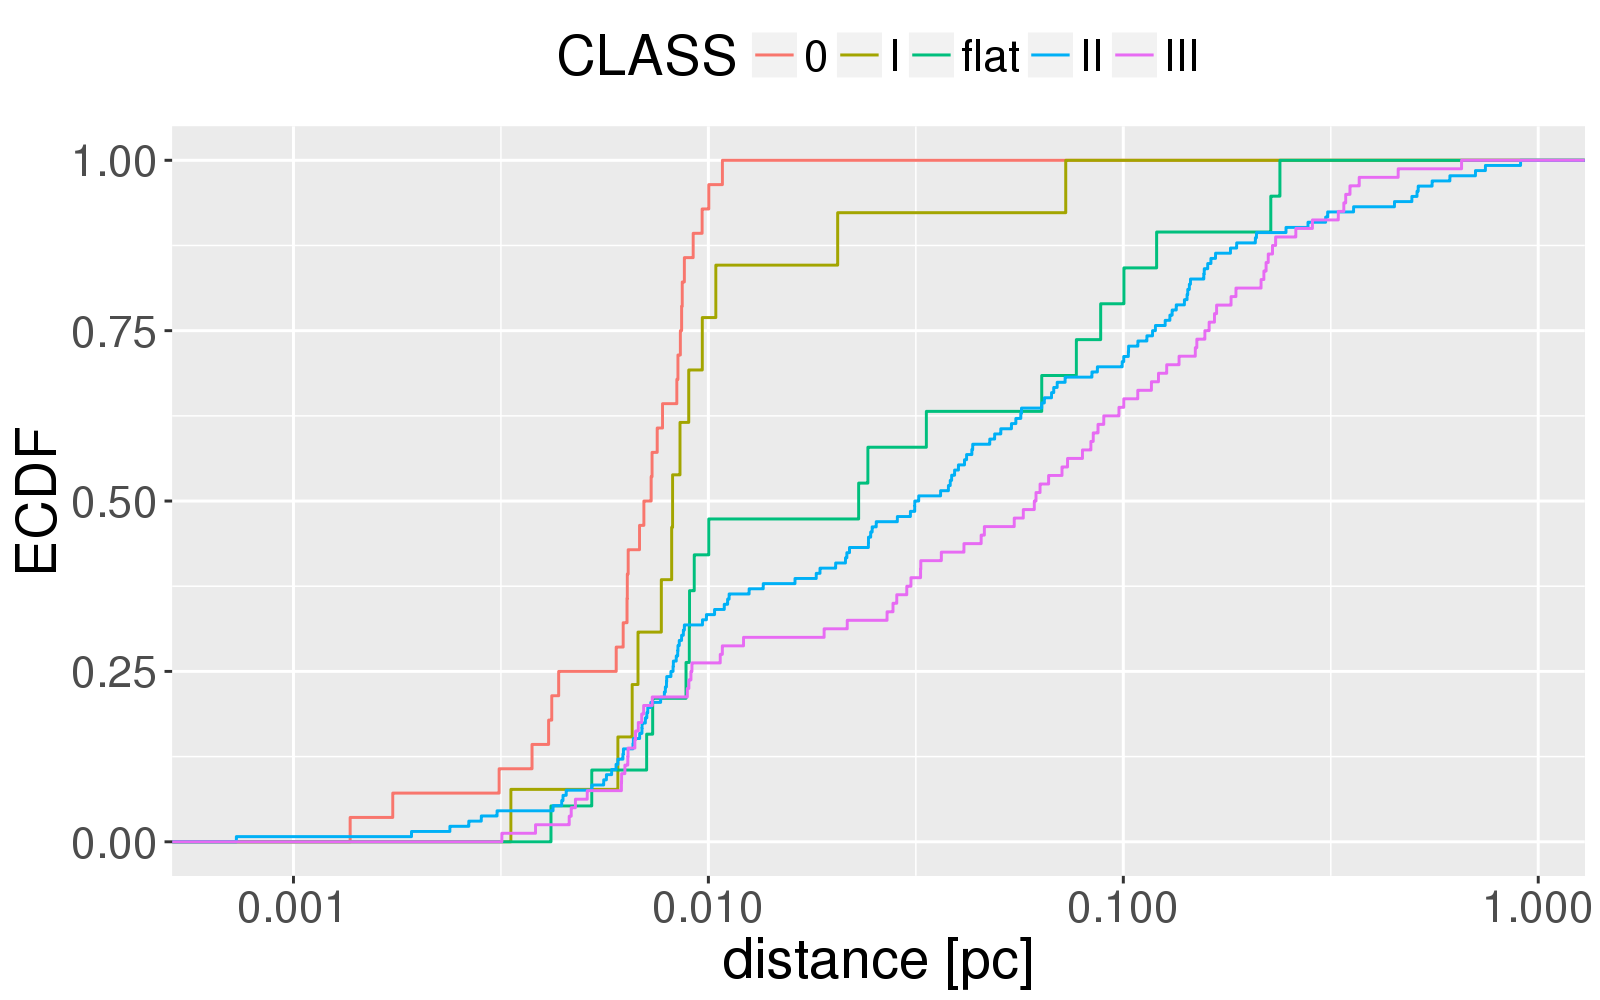
YSOs vs. ISM concentrations
- "distance" correlates with age of the sources
- \(0.1~{\rm pc} = 0.1~{\rm km~s}^{-1} \times 10^6\) yrs
- age-evolution of the YSO distributions
(Doi+ 2015, PASJ, 67(3), 50)
Dust column at adjacent ISM peaks
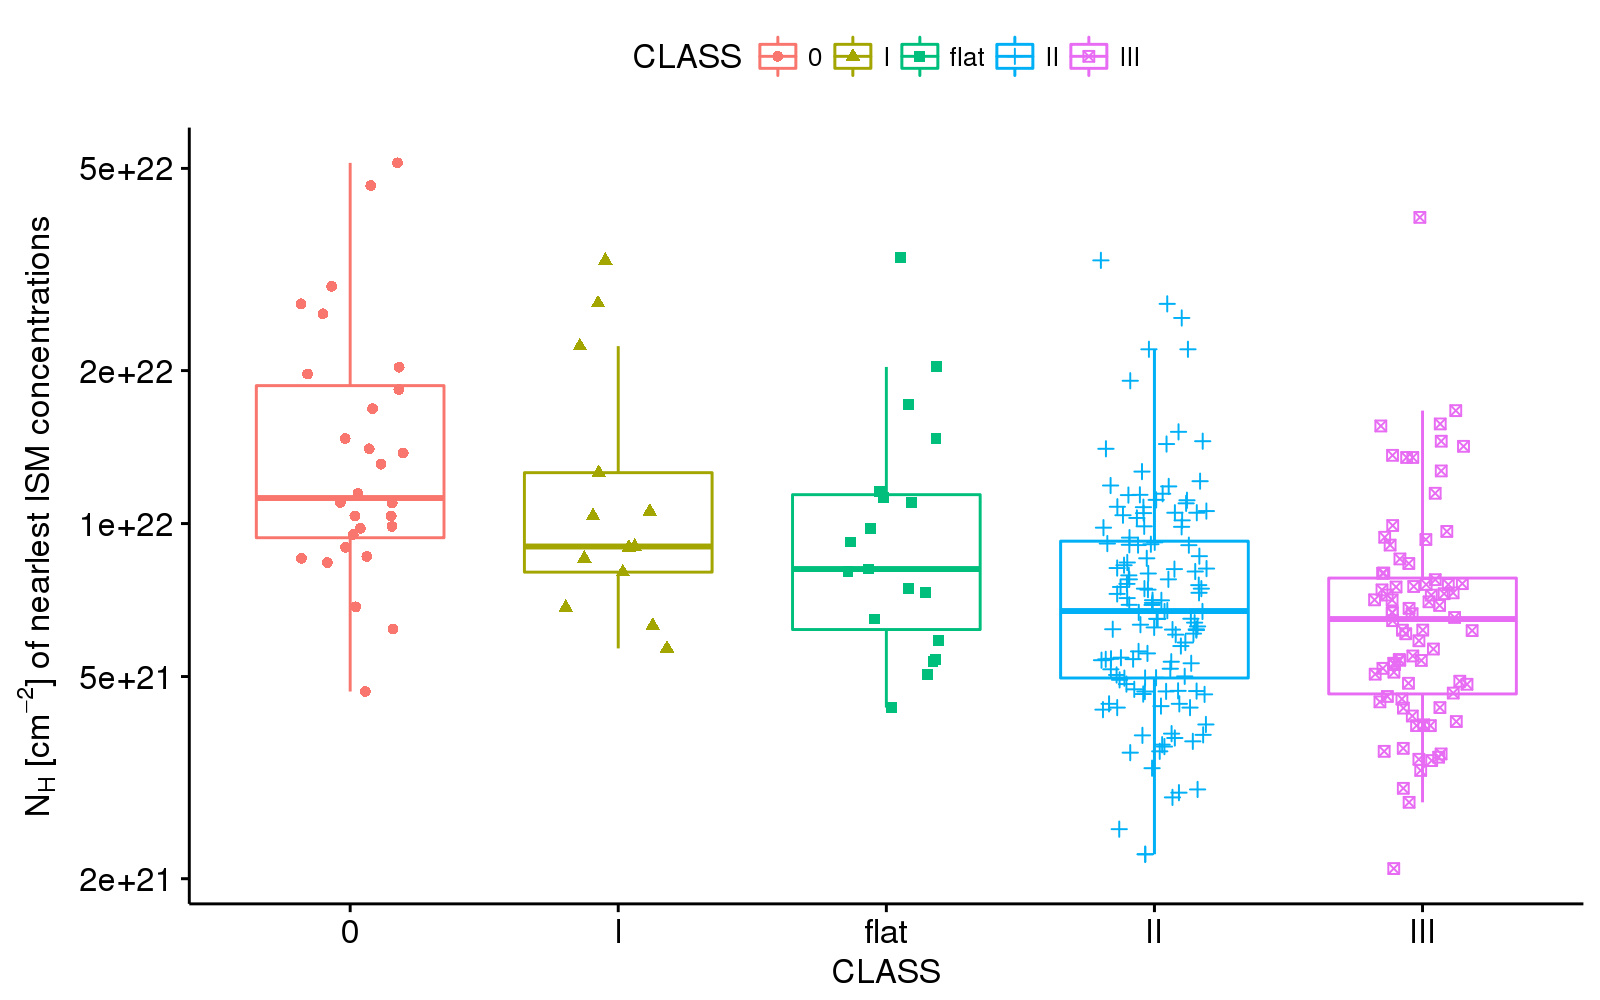
YSOs vs. ISM concentrations
- "distance" correlates with age of the sources
- \(0.1~{\rm pc} = 0.1~{\rm km~s}^{-1} \times 10^6\) yrs
- age-evolution of the YSO distributions
(Doi+ 2015, PASJ, 67(3), 50)
- "density" correlates with age of the sources
- age-evolution of ISM structures (filaments)
- mass loss rate: \(< 10~ {\rm M_{\odot}pc^{-1}Myr^{-1}}\)
- cf. mass accretion rate: \(27-50~ {\rm M_{\odot}pc^{-1}Myr^{-1}}\) (Palmeirim+ 2013, A&A, 550, A38)
Statistical inference on age evolution of star-formation environment "after" the formation of stars.
life cycle of filaments
- mass accretion along B-field (through striations)
- exceeds critical mass \(\to\) starts to form stars
- termination of mass accretion
- eating up surrounding material
- strip off by SNe shocks
- cf. \(M_{\rm dense~cores}/M_{\rm filament} \leq 15\%\) (eg. \({\rm Andr\acute{e}}\)+ 2014)
- dissipation due to ISRF/radiation from internal YSOs
\(\to\) star-formation ends
Cloud erosion by ISRF

Dust column density at each YSO
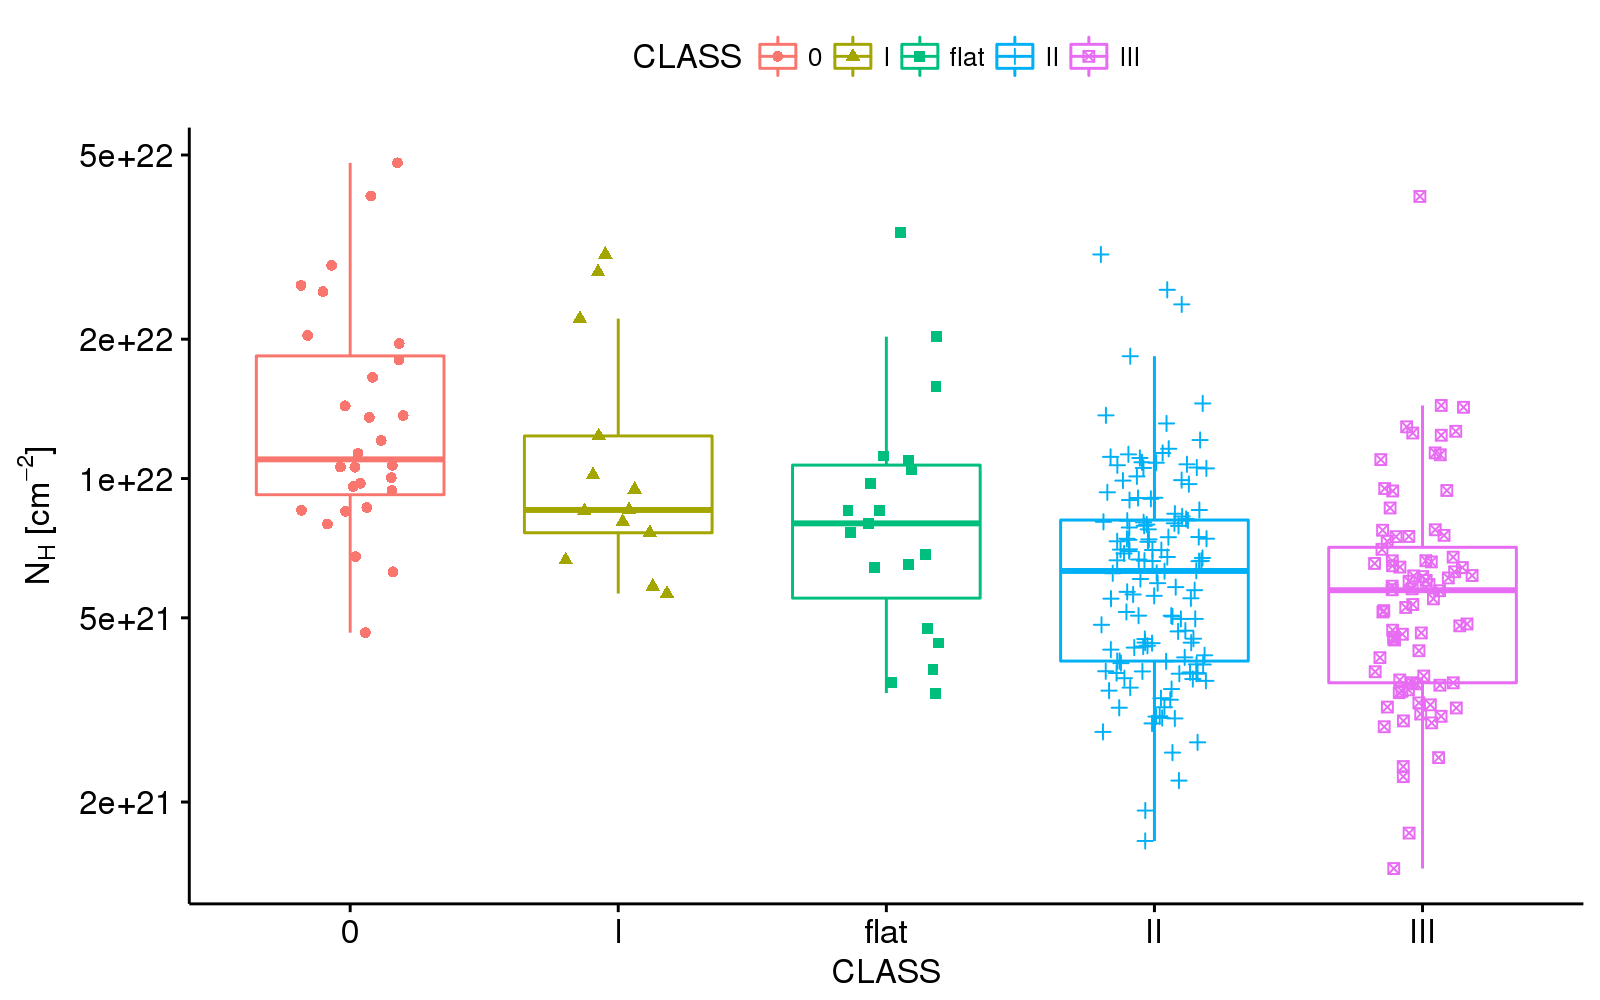
Summary
- All-sky high-resolution dust map by AKARI
- spatial resolution \(\sim 2'\)
- better than other full-sky dust maps/extinction maps
- achieves \(\leq 0.1\)pc resolution for local molecular clouds
- Excellent correlation with Planck dust map
- Dust SED variation from diffuse to dense ISM
- Dust characteristics change in low \(G_0\) (dense) regions
- Statistical inference on ISM structures
- alignment with B-field and its density depencence
- age-evolution before/after the star-formation
 (
( (
( (
( (
( (
(